
Page 106 - Water Engineering Hydraulics, Distribution and Treatment
P. 106
84
Water Sources: Groundwater
Chapter 3
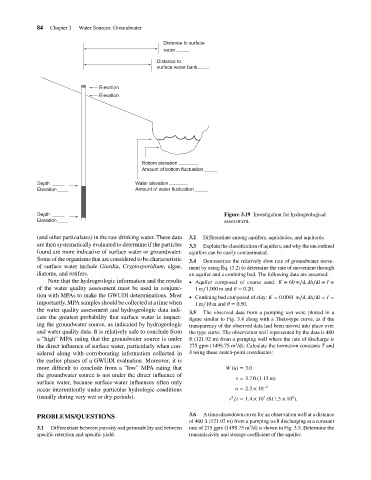
Distance to surface
water
Distance to
surface water bank
Elevation
Elevation
Bottom elevation
Amount of bottom fluctuation
Depth Water elevation
Elevation Amount of water fluctuation
Depth Figure 3.19 Investigation for hydrogeological
Elevation assessment.
(and other particulates) in the raw drinking water. These data 3.2 Differentiate among aquifers, aquicludes, and aquitards.
are then systematically evaluated to determine if the particles 3.3 Explain the classification of aquifers, and why the unconfined
found are more indicative of surface water or groundwater. aquifers can be easily contaminated.
Some of the organisms that are considered to be characteristic 3.4 Demonstrate the relatively slow rate of groundwater move-
of surface water include Giardia, Cryptosporidium, algae, ment by using Eq. (3.2) to determine the rate of movement through
diatoms, and rotifers. an aquifer and a confining bed. The following data are assumed:
Note that the hydrogeologic information and the results Aquifer composed of coarse sand: K = 60 m∕d, dh∕dl = I =
of the water quality assessment must be used in conjunc- 1m∕1,000 m and = 0.20.
tion with MPAs to make the GWUDI determinations. Most Confining bed composed of clay: K = 0.0001 m∕d, dh∕dl = I =
importantly, MPA samples should be collected at a time when 1m∕10 m and = 0.50.
the water quality assessment and hydrogeologic data indi-
3.5 The observed data from a pumping test were plotted in a
cate the greatest probability that surface water is impact- figure similar to Fig. 3.4 along with a Theis-type curve, as if the
ing the groundwater source, as indicated by hydrogeologic transparency of the observed data had been moved into place over
and water quality data. It is relatively safe to conclude from the type curve. The observation well represented by the data is 400
a “high” MPA rating that the groundwater source is under ft (121.92 m) from a pumping well where the rate of discharge is
3
the direct influence of surface water, particularly when con- 275 gpm (1498.75 m /d). Calculate the formation constants T and
sidered along with corroborating information collected in S using these match-point coordinates:
the earlier phases of a GWUDI evaluation. Moreover, it is
more difficult to conclude from a “low” MPA rating that W (u) = 3.0
the groundwater source is not under the direct influence of
s = 3.7ft(1.13 m)
surface water, because surface-water influences often only
occur intermittently under particular hydrologic conditions u = 2.3 × 10 −2
(usually during very wet or dry periods). 2 7 6
r ∕t = 1.4 × 10 (SI 1.3 × 10 ).
PROBLEMS/QUESTIONS 3.6 A time–drawdown curve for an observation well at a distance
of 400 ft (121.92 m) from a pumping well discharging at a constant
3
3.1 Differentiate between porosity and permeability and between rate of 275 gpm (1498.75 m /d) is shown in Fig. 3.5. Determine the
specific retention and specific yield. transmissivity and storage coefficient of the aquifer.