Page 110 - Water Engineering Hydraulics, Distribution and Treatment
P. 110

88
                                         Chapter 4
                                                  Quantities of Water Demand
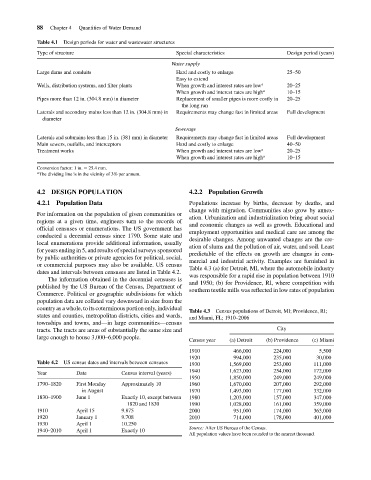
                                             Design periods for water and wastewater structures
                                    Table 4.1
                                                                                  Special characteristics
                                    Type of structure
                                                                                 Water supply
                                                                                                                       25–50
                                    Large dams and conduits
                                                                                  Hard and costly to enlarge
                                                                                  Easy to extend
                                                                                                                       20–25
                                                                                  When growth and interest rates are low
                                    Wells, distribution systems, and filter plants
                                                                                  When growth and interest rates are high
                                                                                                                       10–15
                                    Pipes more than 12 in. (304.8 mm) in diameter
                                                                                                                       20–25
                                                                                  Replacement of smaller pipes is more costly in
                                                                                    the long run
                                                                                                                       Full development
                                                                                  Requirements may change fast in limited areas
                                    Laterals and secondary mains less than 12 in. (304.8 mm) in
                                      diameter
                                                                                  Sewerage                    a a      Design period (years)
                                    Laterals and submains less than 15 in. (381 mm) in diameter  Requirements may change fast in limited areas  Full development
                                    Main sewers, outfalls, and interceptors       Hard and costly to enlarge           40–50
                                    Treatment works                               When growth and interest rates are low a  20–25
                                                                                  When growth and interest rates are high a  10–15
                                    Conversion factor: 1 in. = 25.4mm.
                                    a The dividing line is in the vicinity of 3% per annum.
                                    4.2 DESIGN POPULATION                              4.2.2 Population Growth
                                    4.2.1 Population Data                              Populations increase by births, decrease by deaths, and
                                                                                       change with migration. Communities also grow by annex-
                                    For information on the population of given communities or
                                                                                       ation. Urbanization and industrialization bring about social
                                    regions at a given time, engineers turn to the records of
                                                                                       and economic changes as well as growth. Educational and
                                    official censuses or enumerations. The US government has
                                                                                       employment opportunities and medical care are among the
                                    conducted a decennial census since 1790. Some state and
                                                                                       desirable changes. Among unwanted changes are the cre-
                                    local enumerations provide additional information, usually
                                                                                       ation of slums and the pollution of air, water, and soil. Least
                                    for years ending in 5, and results of special surveys sponsored
                                                                                       predictable of the effects on growth are changes in com-
                                    by public authorities or private agencies for political, social,
                                                                                       mercial and industrial activity. Examples are furnished in
                                    or commercial purposes may also be available. US census
                                                                                       Table 4.3 (a) for Detroit, MI, where the automobile industry
                                    dates and intervals between censuses are listed in Table 4.2.
                                                                                       was responsible for a rapid rise in population between 1910
                                        The information obtained in the decennial censuses is
                                                                                       and 1950; (b) for Providence, RI, where competition with
                                    published by the US Bureau of the Census, Department of
                                                                                       southern textile mills was reflected in low rates of population
                                    Commerce. Political or geographic subdivisions for which
                                    population data are collated vary downward in size from the
                                    country as a whole, to its coterminous portion only, individual
                                                                                       Table 4.3  Census populations of Detroit, MI; Providence, RI;
                                    states and counties, metropolitan districts, cities and wards,
                                                                                       and Miami, FL; 1910–2006
                                    townships and towns, and—in large communities—census
                                    tracts. The tracts are areas of substantially the same size and                 City
                                    large enough to house 3,000–6,000 people.
                                                                                       Census year  (a) Detroit  (b) Providence  (c) Miami
                                                                                       1910          466,000      224,000        5,500
                                                                                       1920          994,000      235,000        30,000
                                    Table 4.2  US census dates and intervals between censuses  1930  1,569,000    253,000       111,000
                                    Year         Date           Census interval (years)  1940       1,623,000     254,000       172,000
                                                                                       1950         1,850,000     249,000       249,000
                                    1790–1820    First Monday   Approximately 10       1960         1,670,000     207,000       292,000
                                                   in August                           1970         1,493,000     177,000       332,000
                                    1830–1900    June 1         Exactly 10, except between  1980    1,203,000     157,000       347,000
                                                                  1820 and 1830        1990         1,028,000     161,000       359,000
                                    1910         April 15       9.875                  2000          951,000      174,000       363,000
                                    1920         January 1      9.708                  2010          714,000      178,000       401,000
                                    1930         April 1        10.250
                                                                                       Source: After US Bureau of the Census.
                                    1940–2010    April 1        Exactly 10
                                                                                       All population values have been rounded to the nearest thousand.
   105   106   107   108   109   110   111   112   113   114   115