
Page 112 - Water Engineering Hydraulics, Distribution and Treatment
P. 112
90
Chapter 4
Quantities of Water Demand
4.2.3 Short-Term Population Estimates
In similar fashion, Eq. (4.8) states that
Estimates of midyear populations for current years and the
k
= (log y − log y )∕(t − t )
j
i
i
j
arithmetic
recent past are normally derived by arithmetic from census
data. They are needed perhaps most often for (a) computing
m
per capita water consumption and wastewater release and (b)
intercensal and postcensal years are as follows:
calculating the annual birth and general death rates per 1000
inhabitants, or specific disease and death rates per 100,000
Intercensal:
inhabitants.
(4.15)
log y =log y + (t − t )( log y −log y )∕(t − t )
Understandably, morbidity and mortality rates from
j
i
i
m
m
i
j
i
waterborne and otherwise water-related diseases are of deep
Postcensal:
concern to sanitary engineers.
For years between censuses or after the last census, esti- and the logarithms of the midyear populations, log y ,for
log y =log y + (t − t )( log y −log y )∕(t − t ) (4.16)
m
j
i
j
i
j
m
j
mates are usually interpolated or extrapolated as arithmetic
or geometric progressions. If t and t are the dates of two Geometric estimates, therefore, use the logarithms of
i
j
sequent censuses and t is the midyear date of the year for the population parameters in the same way as the popula-
m
which a population estimate is wanted, the rate of arithmetic tion parameters themselves are employed in arithmetic esti-
growth is given by Eq. (4.9) as mates; moreover, the arithmetic increase corresponds to cap-
/ ital growth by simple interest, and the geometric increase
k arithmetic = y − y (t − t )
i
i
j
j
to capital growth by compound interest. Graphically, arith-
and the midyear populations, y , of intercensal and postcen- metic progression is characterized by a straight-line plot
m
sal years are as follows: against arithmetic scales for both population and time on
double-arithmetic coordinate paper and, thus, geometric as
Intercensal: well as first-order progression by a straight-line plot against
/ a geometric (logarithmic) population scale and an arithmetic
y = y + (t − t )(y − y ) (t − t ) (4.13)
j
i
i
j
i
m
m
i
timescale on semilogarithmic paper. The suitable equation
Postcensal: and method of plotting are best determined by inspection
from a basic arithmetic plot of available historic population
y = y + (t − t )(y − y )∕(t − t ) (4.14)
m j m j j i j i information.
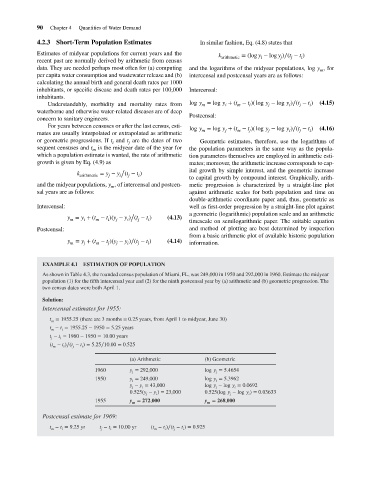
EXAMPLE 4.1 ESTIMATION OF POPULATION
As shown in Table 4.3, the rounded census population of Miami, FL, was 249,000 in 1950 and 292,000 in 1960. Estimate the midyear
population (1) for the fifth intercensal year and (2) for the ninth postcensal year by (a) arithmetic and (b) geometric progression. The
two census dates were both April 1.
Solution:
Intercensal estimates for 1955:
t = 1955.25 (there are 3 months = 0.25 years, from April 1 to midyear, June 30)
m
t − t = 1955.25 − 1950 = 5.25 years
m
i
t − t = 1960 − 1950 = 10.00 years
j
i
(t − t )∕(t − t ) = 5.25∕10.00 = 0.525
i
i
m
j
(a) Arithmetic (b) Geometric
1960 y = 292,000 log y = 5.4654
j
j
1950 y = 249,000 log y = 5.3962
i
i
y − y = 43,000 log y −log y = 0.0692
i
j
i
j
0.525(y − y ) = 23,000 0.525(log y −log y ) = 0.03633
j
i
j
i
1955 y = 272,000 y = 268,000
m
m
Postcensal estimate for 1969:
t − t = 9.25 yr t − t = 10.00 yr (t − t )∕(t − t ) = 0.925
m i j i m i j i