
Page 115 - Water Engineering Hydraulics, Distribution and Treatment
P. 115
93
4.3 Water Consumption
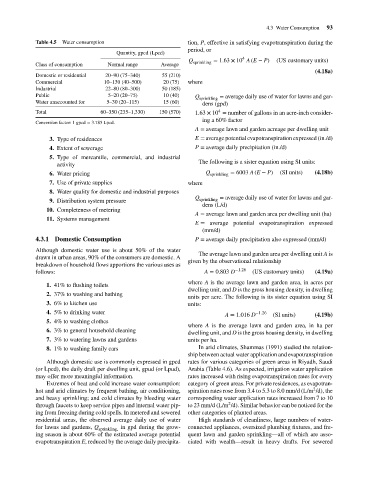
Table 4.5
Water consumption
period, or
4
= 1.63 × 10 A (E − P)
Q
(US customary units)
sprinkling
Average
Normal range
Class of consumption
(4.18a)
20–90 (75–340)
Domestic or residential
where
20 (75)
10–130 (40–500)
Commercial
22–80 (80–300)
50 (185)
Industrial
10 (40)
5–20 (20–75)
Public
Q
= average daily use of water for lawns and gar-
sprinkling
15 (60)
5–30 (20–115)
Water unaccounted for
dens (gpd)
4
Total
150 (570)
60–350 (235–1,330)
1.63 × 10 = number of gallons in an acre-inch consider-
ing a 60% factor
Conversion factor: 1 gpcd = 3.785 Lpcd. Quantity, gpcd (Lpcd) 55 (210) tion, P, effective in satisfying evapotranspiration during the
A = average lawn and garden acreage per dwelling unit
3. Type of residences E = average potential evapotranspiration expressed (in./d)
4. Extent of sewerage P = average daily precipitation (in./d)
5. Type of mercantile, commercial, and industrial
The following is a sister equation using SI units:
activity
6. Water pricing Q sprinkling = 6003 A (E − P) (SI units) (4.18b)
7. Use of private supplies where
8. Water quality for domestic and industrial purposes
Q sprinkling = average daily use of water for lawns and gar-
9. Distribution system pressure
dens (L/d)
10. Completeness of metering
A = average lawn and garden area per dwelling unit (ha)
11. Systems management
E = average potential evapotranspiration expressed
(mm/d)
4.3.1 Domestic Consumption P = average daily precipitation also expressed (mm/d)
Although domestic water use is about 50% of the water
The average lawn and garden area per dwelling unit A is
drawn in urban areas, 90% of the consumers are domestic. A
given by the observational relationship
breakdown of household flows apportions the various uses as
follows: A = 0.803 D −1.26 (US customary units) (4.19a)
where A is the average lawn and garden area, in acres per
1. 41% to flushing toilets
dwelling unit, and D is the gross housing density, in dwelling
2. 37% to washing and bathing
units per acre. The following is its sister equation using SI
3. 6% to kitchen use units:
4. 5% to drinking water −1.26
A = 1.016 D (SI units) (4.19b)
5. 4% to washing clothes
where A is the average lawn and garden area, in ha per
6. 3% to general household cleaning
dwelling unit, and D is the gross housing density, in dwelling
7. 3% to watering lawns and gardens units per ha.
8. 1% to washing family cars In arid climates, Shammas (1991) studied the relation-
ship between actual water application and evapotranspiration
Although domestic use is commonly expressed in gpcd rates for various categories of green areas in Riyadh, Saudi
(or Lpcd), the daily draft per dwelling unit, gpud (or Lpud), Arabia (Table 4.6). As expected, irrigation water application
may offer more meaningful information. rates increased with rising evapotranspiration rates for every
Extremes of heat and cold increase water consumption: category of green areas. For private residences, as evapotran-
2
hot and arid climates by frequent bathing, air conditioning, spiration rates rose from 3.4 to 5.3 to 8.0 mm/d (L/m /d), the
and heavy sprinkling; and cold climates by bleeding water corresponding water application rates increased from 7 to 10
2
through faucets to keep service pipes and internal water pip- to 23 mm/d (L/m /d). Similar behavior can be noticed for the
ing from freezing during cold spells. In metered and sewered other categories of planted areas.
residential areas, the observed average daily use of water High standards of cleanliness, large numbers of water-
for lawns and gardens, Q sprinkling, in gpd during the grow- connected appliances, oversized plumbing fixtures, and fre-
ing season is about 60% of the estimated average potential quent lawn and garden sprinkling—all of which are asso-
evapotranspiration E, reduced by the average daily precipita- ciated with wealth—result in heavy drafts. For sewered