
Page 114 - Water Engineering Hydraulics, Distribution and Treatment
P. 114
92
Chapter 4
Quantities of Water Demand
of successive saturation estimates L, which are eventually
verified graphically by lying closely in a straight line on a
Persons/acre
logistic-arithmetic plot. The percentage saturation P is
1. Residential areas
P = 100y∕L = 100∕[1 + p exp(−qt)]
12–37
(a) Single-family dwellings,
and
large lots
15–35
(b) Single-family dwellings,
37–87
ln[(100 − P)∕P] =ln p − qt
small lots
The straight line of best fit by eye has an ordinate inter-
87–247
(c) Multiple-family dwellings,
35–100
cept ln p and a slope –q when ln[(100 − P)∕P] is plotted
small lots
247–2,470
100–1,000
(d) Apartment or tenement
against t or values of n[(100 − P)∕P] are scaled in either
or more
houses
direction from a 50th percentile or middle ordinate.
37–74
2. Mercantile and commercial
15–30
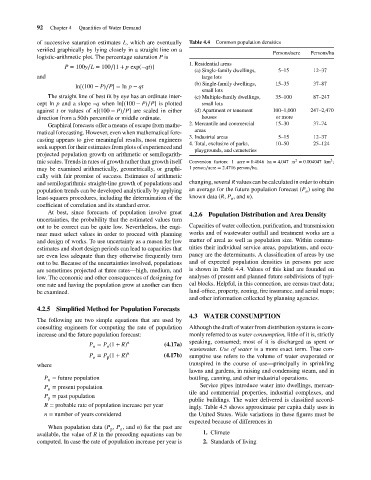
Graphical forecasts offer a means of escape from mathe- Table 4.4 Common population densities 5–15 Persons/ha
areas
matical forecasting. However, even when mathematical fore-
3. Industrial areas 5–15 12–37
casting appears to give meaningful results, most engineers
4. Total, exclusive of parks, 10–50 25–124
seek support for their estimates from plots of experienced and
playgrounds, and cemeteries
projected population growth on arithmetic or semilogarith-
2
2
mic scales. Trends in rates of growth rather than growth itself Conversion factors: 1 acre = 0.4046 ha = 4,047 m = 0.004047 km ;
may be examined arithmetically, geometrically, or graphi- 1person∕acre = 2.4716 person∕ha.
cally with fair promise of success. Estimates of arithmetic
and semilogarithmic straight-line growth of populations and changing, several R values can be calculated in order to obtain
population trends can be developed analytically by applying an average for the future population forecast (P )using the
n
least-squares procedures, including the determination of the known data (R, P , and n).
o
coefficient of correlation and its standard error.
At best, since forecasts of population involve great
4.2.6 Population Distribution and Area Density
uncertainties, the probability that the estimated values turn
out to be correct can be quite low. Nevertheless, the engi- Capacities of water collection, purification, and transmission
neer must select values in order to proceed with planning works and of wastewater outfall and treatment works are a
and design of works. To use uncertainty as a reason for low matter of areal as well as population size. Within commu-
estimates and short design periods can lead to capacities that nities their individual service areas, populations, and occu-
are even less adequate than they otherwise frequently turn pancy are the determinants. A classification of areas by use
out to be. Because of the uncertainties involved, populations and of expected population densities in persons per acre
are sometimes projected at three rates—high, medium, and is shown in Table 4.4. Values of this kind are founded on
low. The economic and other consequences of designing for analyses of present and planned future subdivisions of typi-
one rate and having the population grow at another can then cal blocks. Helpful, in this connection, are census tract data;
be examined. land-office, property, zoning, fire insurance, and aerial maps;
and other information collected by planning agencies.
4.2.5 Simplified Method for Population Forecasts
4.3 WATER CONSUMPTION
The following are two simple equations that are used by
consulting engineers for computing the rate of population Although the draft of water from distribution systems is com-
increase and the future population forecast: monly referred to as water consumption, little of it is, strictly
P = P (1 + R) n (4.17a) speaking, consumed; most of it is discharged as spent or
n
o
wastewater. Use of water is a more exact term. True con-
P = P (1 + R) n (4.17b) sumptive use refers to the volume of water evaporated or
p
o
where transpired in the course of use—principally in sprinkling
lawns and gardens, in raising and condensing steam, and in
P = future population bottling, canning, and other industrial operations.
n
P = present population Service pipes introduce water into dwellings, mercan-
o
tile and commercial properties, industrial complexes, and
P = past population
p
public buildings. The water delivered is classified accord-
R = probable rate of population increase per year ingly. Table 4.5 shows approximate per capita daily uses in
n = number of years considered the United States. Wide variations in these figures must be
expected because of differences in
When population data (P , P , and n) for the past are
o
p
available, the value of R in the preceding equations can be 1. Climate
computed. In case the rate of population increase per year is 2. Standards of living