
Page 116 - Water Engineering Hydraulics, Distribution and Treatment
P. 116
94
Quantities of Water Demand
Chapter 4
Table 4.6
Relationship of irrigation water application rates to evapotranspiration in arid areas
Period
December–January
February–March
a
a
b
a
b
b
Overall
I/E
I
E
E
I/E
I
I/E
I
E
2
2
2
(mm/d)
(L/m /d)
(L/m /d)
(mm/d)
ratio
(mm/d)
Category
2.9
3.4
7.0
2.3
Private residences
23
1.9
10
2.1
8.0
Road medians
15
4.1
3.4
4.4
8.0
15
2.8
3.8
5.3
33
8.0
5.3
3.4
12
1.3
7.0
0.9
1.5
3.0
Public parks
1.2
1.0
0.6
Special developments
5.3
0.8
0.6
3.0
6.0
3.4
8.0
0.3
2
2
2
3
Conversion factors: 1 gpd/ft = 0.0408 m /m /d = 40.8 L/m /d; 1 in./d = 25.4 mm/d. 5.3 ratio (L/m /d) April–May ratio I/E ratio
a I = irrigation rate (L/m /d).
2
b E = evapotranspiration rate (mm/d equivalent to L/m /d).
2
properties, the average domestic use of water Q domestic ,in pressure head, and high distribution pressures raise the rate
gpud or Lpud for each dwelling unit, is related to the aver- of discharge and with it the waste of water from fixtures and
age market value M of the units in thousands of current US leaks. Ordinarily, systems pressures are not raised above 60
2
dollars by the following observational equations: psig (lb/in. gauge), or 416 kPa, in American practice, even
though it is impossible to employ direct hydrant streams
Q domestic = 157 + 3.46MF (US customary units) in firefighting when hydrant pressures are below 75 psig
(4.20a) (520 kPa).
Metering encourages thrift and normalizes the demand.
Q domestic = 594 + 13.1MF (SI units) (4.20b) The costs of metering and the running expense of reading and
Where F is the site/time factor to be determined by a repairing meters, however, are substantial. They may be jus-
planning engineer periodically. It is important to note that tified in part by accompanying reductions in waste and pos-
these mathematical models do vary with time and locations; sible postponement of otherwise needed extensions. Under
therefore, they must be modified and updated for a specific study and on trial here and there is the encouragement of off-
site/time situations. peak-hour draft of water by large users. To this purpose, rates
charged for water drawn during off-peak hours are lowered
preferentially. The objective is to reap the economic benefits
4.3.2 General Urban Water Demands of a relatively steady flow of water within the system and
the resulting proportionately reduced capacity requirements
Some commercial enterprises—hotels and restaurants, for
of systems components. The water drawn during off-peak
instance—draw much water; so do industries such as brew-
hours is generally stored by the user at ground level even
eries, canneries, laundries, paper mills, and steel mills. Indus-
when this entails repumping.
tries, in particular, draw larger volumes of water when it is
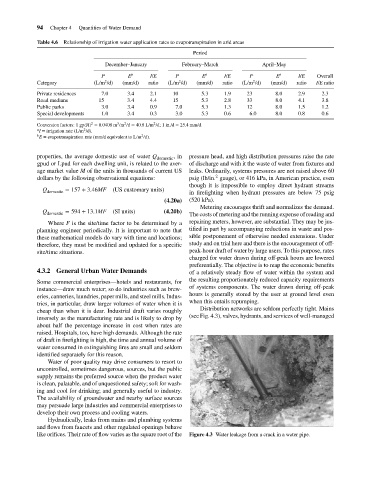
Distribution networks are seldom perfectly tight. Mains
cheap than when it is dear. Industrial draft varies roughly
(see Fig. 4.3), valves, hydrants, and services of well-managed
inversely as the manufacturing rate and is likely to drop by
about half the percentage increase in cost when rates are
raised. Hospitals, too, have high demands. Although the rate
of draft in firefighting is high, the time and annual volume of
water consumed in extinguishing fires are small and seldom
identified separately for this reason.
Water of poor quality may drive consumers to resort to
uncontrolled, sometimes dangerous, sources, but the public
supply remains the preferred source when the product water
is clean, palatable, and of unquestioned safety; soft for wash-
ing and cool for drinking; and generally useful to industry.
The availability of groundwater and nearby surface sources
may persuade large industries and commercial enterprises to
develop their own process and cooling waters.
Hydraulically, leaks from mains and plumbing systems
and flows from faucets and other regulated openings behave
like orifices. Their rate of flow varies as the square root of the Figure 4.3 Water leakage from a crack in a water pipe.