
Page 117 - Water Engineering Hydraulics, Distribution and Treatment
P. 117
95
4.3 Water Consumption
4.3.3 Industrial Water Consumption
systems are therefore regularly checked for leaks. Superficial
signs of controllable leakage are
The amounts of water used by industry vary widely. Some
industries draw in excess of 50 MGD (190 MLD); others,
1. High night flows in mains
no more than comparably sized mercantile establishments.
2. Water running in street gutters
On average, US industry satisfies more than 60% of its water
3. Moist pavements
requirements by internal reuse and less than 40% by draft
through plant intakes from its own water sources or through
4. Persistent seepage
service connections from public water systems. Only about
5. Excessive flows in sewers
7% of the water taken in is consumed; 93% is returned to open
6. Abnormal pressure drops
waterways or to the ground, whence it may be removed again
7. Unusually green vegetation (in dry climates)
by downstream users. On balance, industry’s consumptive
use is kept down to 2% of the draft of all water users in
Leakage is detected by (a) driving rods into the ground
the United States. Table 4.8 shows the relative amounts of
to test for moist earth, (b) using a sounding method in which
water consumed by different industries. Not brought out is
listening devices amplify the sound of running water, (c)
the fact that once-through cooling, particularly by the power
conducting a leak noise correlation that is based on a sonic
industry, is by far the biggest use component and the principal
technique, (d) tracing leaks by injecting a gas into the network
contributor to the thermal pollution of receiving waters.
and detecting its escape by a suitable instrument to determine
To draw comparisons between the water uses of dif-
the location of the leak, and (e) inspecting premises for leaky
ferent industries and of plants within the same industrial
plumbing and fixtures. Leakage detection of well-managed
category, it is customary to express plant or process use in
waterworks may be complemented by periodic and intensive
volumes of water—gallons, for instance—per unit of pro-
but, preferably, routine and extensive water-waste surveys.
duction (Table 4.9). For the chemical industry, however, this
Generally involved is the isolation of comparatively small
may not be meaningful, because of the diversity of chemicals
sections of the distribution system by closing valves on most
produced.
or all feeder mains and measuring the water entering the sec-
Rising water use can be arrested by conserving plant
tion at night through one or more open valves or added pip-
supplies and introducing efficient processes and operations.
ing on fire hoses. Common means of measurement are pitot
Most important, perhaps, are the economies of multiple reuse
tubes, bypass meters around controlling valves, or meters on
through countercurrent rinsing of products, recirculation of
one or more hose lines between hydrants that straddle closed
cooling and condensing waters, and reuse of otherwise spent
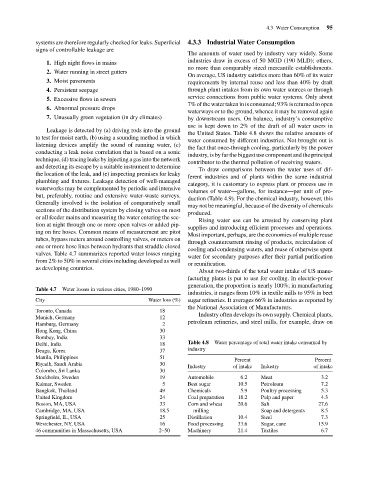
valves. Table 4.7 summarizes reported water losses ranging
water for secondary purposes after their partial purification
from 2% to 50% in several cities including developed as well
or reunification.
as developing countries.
About two-thirds of the total water intake of US manu-
facturing plants is put to use for cooling. In electric-power
generation, the proportion is nearly 100%; in manufacturing
Table 4.7 Water losses in various cities, 1980–1990
industries, it ranges from 10% in textile mills to 95% in beet
City Water loss (%) sugar refineries. It averages 66% in industries as reported by
the National Association of Manufacturers.
Toronto, Canada 18
Industry often develops its own supply. Chemical plants,
Munich, Germany 12
petroleum refineries, and steel mills, for example, draw on
Hamburg, Germany 2
Hong Kong, China 30
Bombay, India 33
Delhi, India 18 Table 4.8 Water percentage of total water intake consumed by
Deagu, Korea 37 industry
Manila, Philippines 51
Percent Percent
Riyadh, Saudi Arabia 30
Industry of intake Industry of intake
Colombo, Sri Lanka 30
Stockholm, Sweden 19 Automobile 6.2 Meat 3.2
Kalmar, Sweden 5 Beet sugar 10.5 Petroleum 7.2
Bangkok, Thailand 49 Chemicals 5.9 Poultry processing 5.3
United Kingdom 24 Coal preparation 18.2 Pulp and paper 4.3
Boston, MA, USA 33 Corn and wheat 20.6 Salt 27.6
Cambridge, MA, USA 18.5 milling Soap and detergents 8.5
Springfield, IL, USA 25 Distillation 10.4 Steel 7.3
Westchester, NY, USA 16 Food processing 33.6 Sugar, cane 15.9
46 communities in Massachusetts, USA 2–50 Machinery 21.4 Textiles 6.7