
Page 119 - Water Engineering Hydraulics, Distribution and Treatment
P. 119
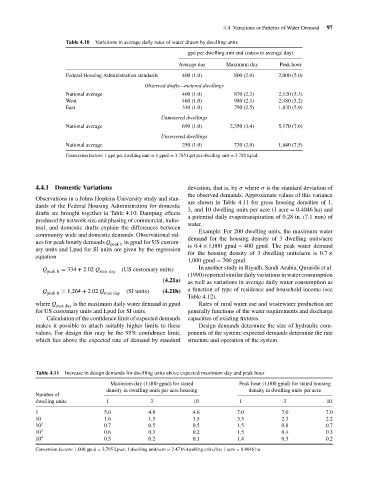
Table 4.10
Variations in average daily rates of water drawn by dwelling units
gpd per dwelling unit and (ratios to average day)
Peak hour
Maximum day
Average day
400 (1.0)
2,000 (5.0)
Federal Housing Administration standards
800 (2.0)
870 (2.2)
2,120 (5.3)
National average
400 (1.0)
2,480 (5.2)
980 (2.1)
460 (1.0)
West
310 (1.0)
790 (2.5)
1,830 (5.9)
East
Unmetered dwellings
2,350 (3.4)
690 (1.0)
National average Observed drafts—metered dwellings 4.4 Variations or Patterns of Water Demand 97
5,170 (7.6)
Unsewered dwellings
National average 250 (1.0) 730 (2.9) 1,840 (7.5)
Conversion factors: 1 gpd per dwelling unit = 1 gpud = 3.785 Lpd per dwelling unit = 3.785 Lpud.
4.4.1 Domestic Variations deviation, that is, by where is the standard deviation of
the observed demands. Approximate values of this variance
Observations in a Johns Hopkins University study and stan-
are shown in Table 4.11 for gross housing densities of 1,
dards of the Federal Housing Administration for domestic
3, and 10 dwelling units per acre (1 acre = 0.4046 ha) and
drafts are brought together in Table 4.10. Damping effects
a potential daily evapotranspiration of 0.28 in. (7.1 mm) of
produced by network size and phasing of commercial, indus-
water.
trial, and domestic drafts explain the differences between
Example: For 200 dwelling units, the maximum water
community-wide and domestic demands. Observational val-
demand for the housing density of 3 dwelling units/acre
ues for peak hourly demands Q in gpud for US custom-
peak h is 0.4 × 1,000 gpud = 400 gpud. The peak water demand
ary units and Lpud for SI units are given by the regression
for the housing density of 3 dwelling units/acre is 0.7 ×
equation
1,000 gpud = 700 gpud.
Q peak h = 334 + 2.02 Q max day (US customary units) In another study in Riyadh, Saudi Arabia, Quraishi et al.
(1990) reported similar daily variations in water consumption
(4.21a) as well as variations in average daily water consumption as
Q peak h = 1,264 + 2.02 Q max day (SI units) (4.21b) a function of type of residence and household income (see
Table 4.12).
where Q max day is the maximum daily water demand in gpud Rates of rural water use and wastewater production are
for US customary units and Lpud for SI units. generally functions of the water requirements and discharge
Calculation of the confidence limit of expected demands capacities of existing fixtures.
makes it possible to attach suitably higher limits to these Design demands determine the size of hydraulic com-
values. For design this may be the 95% confidence limit, ponents of the system; expected demands determine the rate
which lies above the expected rate of demand by standard structure and operation of the system.
Table 4.11 Increase in design demands for dwelling units above expected maximum day and peak hour
Maximum day (1,000 gpud) for stated Peak hour (1,000 gpud) for stated housing
density in dwelling units per acre housing density in dwelling units per acre
Number of
dwelling units 1 3 10 1 3 10
1 5.0 4.8 4.6 7.0 7.0 7.0
10 1.6 1.5 1.5 3.5 2.3 2.2
10 2 0.7 0.5 0.5 1.5 0.8 0.7
10 3 0.6 0.3 0.2 1.5 0.4 0.3
10 4 0.5 0.2 0.1 1.4 0.3 0.2
Conversion factors: 1,000 gpud = 3,785 Lpud; 1 dwelling unit/acre = 2.4716 dwelling units∕ha; 1 acre = 0.4046 ha.