
Page 270 - Water Engineering Hydraulics, Distribution and Treatment
P. 270
248
Chapter 8
Pumping characteristics of system in Example 8.4
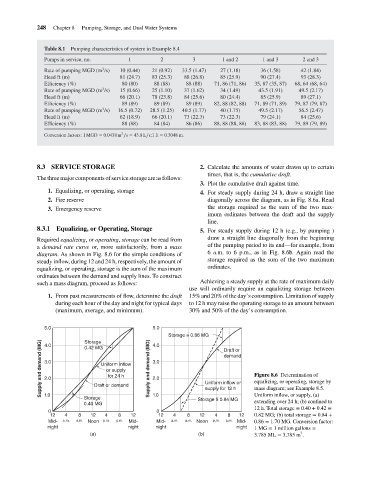
Table 8.1
1
Pumps in service, no.
1 and 3
2 and 3
1 and 2
2
3
3
27 (1.18)
36 (1.58)
10 (0.44)
21 (0.92)
42 (1.84)
Rate of pumping MGD (m /s)
Head ft (m)
83 (25.3)
85 (25.9)
88 (26.8)
93 (28.3)
90 (27.4)
81 (24.7)
88 (88)
88 (88)
Efficiency (%)
80 (80)
3
15 (0.66)
25 (1.10)
34 (1.49)
49.5 (2.17)
43.5 (1.91)
37 (1.62)
Rate of pumping MGD (m /s)
89 (27.1)
85 (25.9)
84 (25.6)
78 (23.8)
66 (20.1)
80 (24.4)
Head ft (m)
71, 89 (71, 89)
Efficiency (%)
89 (89)
79, 87 (79, 87)
89 (89)
82, 88 (82, 88)
89 (89)
3
40.5 (1.77)
40 (1.75)
28.5 (1.25)
56.5 (2.47)
Rate of pumping MGD (m /s)
16.5 (0.72)
49.5 (2.17)
84 (25.6)
73 (22.3)
66 (20.1)
79 (24.1)
62 (18.9)
Head ft (m)
73 (22.3)
84 (84)
Efficiency (%) Pumping, Storage, and Dual Water Systems 33.5 (1.47) 71, 86 (71, 86) 35, 87 (35, 87) 68, 64 (68, 64)
79, 89 (79, 89)
83, 88 (83, 88)
86 (86)
88, 88 (88, 88)
88 (88)
3
Conversion factors: 1 MGD = 0.0438 m ∕s = 43.8L∕s;1 ft = 0.3048 m.
8.3 SERVICE STORAGE 2. Calculate the amounts of water drawn up to certain
times, that is, the cumulative draft.
The three major components of service storage are as follows:
3. Plot the cumulative draft against time.
1. Equalizing, or operating, storage 4. For steady supply during 24 h, draw a straight line
2. Fire reserve diagonally across the diagram, as in Fig. 8.6a. Read
the storage required as the sum of the two max-
3. Emergency reserve
imum ordinates between the draft and the supply
line.
8.3.1 Equalizing, or Operating, Storage 5. For steady supply during 12 h (e.g., by pumping )
Required equalizing,or operating, storage can be read from draw a straight line diagonally from the beginning
a demand rate curve or, more satisfactorily, from a mass of the pumping period to its end—for example, from
diagram. As shown in Fig. 8.6 for the simple conditions of 6 a.m. to 6 p.m., as in Fig. 8.6b. Again read the
steady inflow, during 12 and 24 h, respectively, the amount of storage required as the sum of the two maximum
equalizing, or operating, storage is the sum of the maximum ordinates.
ordinates between the demand and supply lines. To construct
such a mass diagram, proceed as follows: Achieving a steady supply at the rate of maximum daily
use will ordinarily require an equalizing storage between
1. From past measurements of flow, determine the draft 15% and 20% of the day’s consumption. Limitation of supply
during each hour of the day and night for typical days to 12 h may raise the operating storage to an amount between
(maximum, average, and minimum). 30% and 50% of the day’s consumption.
5.0 5.0
Storage = 0.86 MG Draft or
Storage
Supply and demand (MG) 3.0 Uniform inflow Supply and demand (MG) 3.0 Uniform inflow or Figure 8.6 Determination of
4.0
4.0
0.42 MG
demand
or supply
for 24 h
2.0
2.0
equalizing, or operating, storage by
Draft or demand
supply for 12 h
Uniform inflow, or supply, (a)
1.0
Storage 1.0 Storage 5 0.84 MG mass diagram; see Example 8.5.
0.40 MG extending over 24 h; (b) confined to
12 h. Total storage = 0.40 + 0.42 =
0 0
12 4 8 12 4 8 12 12 4 8 12 4 8 12 0.82 MG; (b) total storage = 0.84 +
Mid- a.m. a.m. Noon p.m. p.m. Mid- Mid- a.m. a.m. Noon p.m. p.m. Mid- 0.86 = 1.70 MG. Conversion factor:
night night night night 1MG = 1 million gallons =
3
(a) (b) 3.785 ML = 3,785 m .