
Page 44 - Water Engineering Hydraulics, Distribution and Treatment
P. 44
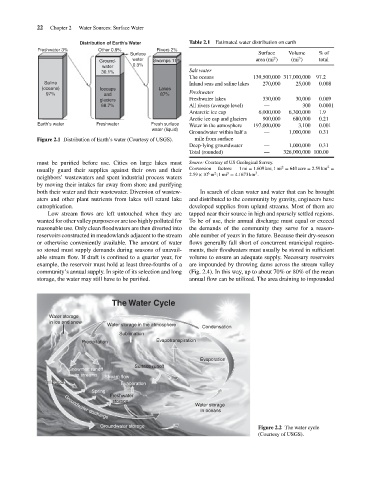
22
Chapter 2
Distribution of Earth’s Water
Rivers 2%
Other 0.9%
Freshwater 3%
Surface
Volume
%of
Surface
3
2
total
water
area (mi )
(mi )
Swamps 11%
Ground-
0.3%
water
Salt water
30.1%
139,500,000 317,000,000
The oceans
Saline
0.008
270,000
Inland seas and saline lakes
(oceans)
Lakes
Icecaps
Freshwater
97%
87%
and
Freshwater lakes
0.009
330,000
30,000
glaciers
68.7%
—
300
0.0001
All rivers (average level)
1.9
Antarctic ice cap
6,000,000
6,300,000
680,000
Arctic ice cap and glaciers
900,000
0.21
Earth’s water Water Sources: Surface Water Fresh surface Table 2.1 Estimated water distribution on earth 25,000 97.2
Freshwater
197,000,000
0.001
Water in the atmosphere
3,100
water (liquid)
Groundwater within half a — 1,000,000 0.31
Figure 2.1 Distribution of Earth’s water (Courtesy of USGS). mile from surface
Deep-lying groundwater — 1,000,000 0.31
Total (rounded) — 326,000,000 100.00
must be purified before use. Cities on large lakes must Source: Courtesy of US Geological Survey. 2 2
usually guard their supplies against their own and their Conversion factors: 1 mi = 1.609 km; 1 mi = 640 acre = 2.59 km =
3
3
6
2
2.59 × 10 m ;1mi = 4.1673 km .
neighbors’ wastewaters and spent industrial process waters
by moving their intakes far away from shore and purifying
both their water and their wastewater. Diversion of wastew- In search of clean water and water that can be brought
aters and other plant nutrients from lakes will retard lake and distributed to the community by gravity, engineers have
eutrophication. developed supplies from upland streams. Most of them are
Low stream flows are left untouched when they are tapped near their source in high and sparsely settled regions.
wanted for other valley purposes or are too highly polluted for To be of use, their annual discharge must equal or exceed
reasonable use. Only clean floodwaters are then diverted into the demands of the community they serve for a reason-
reservoirs constructed in meadowlands adjacent to the stream able number of years in the future. Because their dry-season
or otherwise conveniently available. The amount of water flows generally fall short of concurrent municipal require-
so stored must supply demands during seasons of unavail- ments, their floodwaters must usually be stored in sufficient
able stream flow. If draft is confined to a quarter year, for volume to ensure an adequate supply. Necessary reservoirs
example, the reservoir must hold at least three-fourths of a are impounded by throwing dams across the stream valley
community’s annual supply. In spite of its selection and long (Fig. 2.4). In this way, up to about 70% or 80% of the mean
storage, the water may still have to be purified. annual flow can be utilized. The area draining to impounded
The Water Cycle
Water storage
in ice and snow
Water storage in the atmosphere Condensation
Sublimation
Precipitation Evapotranspiration
Evaporation
Surface runoff
Snowmelt runoff
to streams Stream flow
Infiltration
ation
Inf
iltr
Infiltration Evaporation
Spring
Freshwater
storage
Water storage
in oceans
Groundwater discharge
Groundwater storage Figure 2.2 The water cycle
(Courtesy of USGS).