
Page 256 - Water Loss Control
P. 256
Contr olling Appar ent Losses—Systematic Data Handling Err ors 229
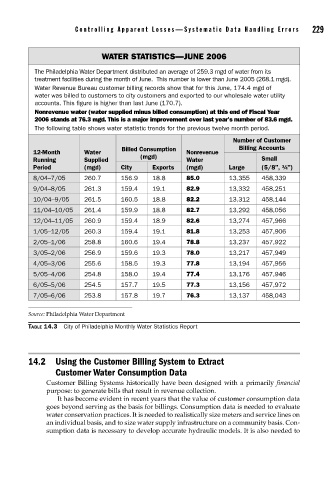
WATER STATISTICS—JUNE 2006
The Philadelphia Water Department distributed an average of 259.3 mgd of water from its
treatment facilities during the month of June. This number is lower than June 2005 (268.1 mgd).
Water Revenue Bureau customer billing records show that for this June, 174.4 mgd of
water was billed to customers to city customers and exported to our wholesale water utility
accounts. This figure is higher than last June (170.7).
Nonrevenue water (water supplied minus billed consumption) at this end of Fiscal Year
2006 stands at 76.3 mgd. This is a major improvement over last year’s number of 83.6 mgd.
The following table shows water statistic trends for the previous twelve month period.
Number of Customer
Billed Consumption Billing Accounts
12-Month Water Nonrevenue
Running Supplied (mgd) Water Small
Period (mgd) City Exports (mgd) Large (5/8", ¾")
8/04–7/05 260.7 156.9 18.8 85.0 13,355 458,339
9/04–8/05 261.3 159.4 19.1 82.9 13,332 458,251
10/04–9/05 261.5 160.5 18.8 82.2 13,312 458,144
11/04–10/05 261.4 159.9 18.8 82.7 13,292 458,056
12/04–11/05 260.9 159.4 18.9 82.6 13,274 457,966
1/05–12/05 260.3 159.4 19.1 81.8 13,253 457,906
2/05–1/06 258.8 160.6 19.4 78.8 13,237 457,922
3/05–2/06 256.9 159.6 19.3 78.0 13,217 457,949
4/05–3/06 255.6 158.5 19.3 77.8 13,194 457,956
5/05–4/06 254.8 158.0 19.4 77.4 13,176 457,946
6/05–5/06 254.5 157.7 19.5 77.3 13,156 457,972
7/05–6/06 253.8 157.8 19.7 76.3 13,137 458,043
Source: Philadelphia Water Department
TABLE 14.3 City of Philadelphia Monthly Water Statistics Report
14.2 Using the Customer Billing System to Extract
Customer Water Consumption Data
Customer Billing Systems historically have been designed with a primarily financial
purpose: to generate bills that result in revenue collection.
It has become evident in recent years that the value of customer consumption data
goes beyond serving as the basis for billings. Consumption data is needed to evaluate
water conservation practices. It is needed to realistically size meters and service lines on
an individual basis, and to size water supply infrastructure on a community basis. Con-
sumption data is necessary to develop accurate hydraulic models. It is also needed to