
Page 259 - Water Loss Control
P. 259
232 Cha pte r F o u r tee n
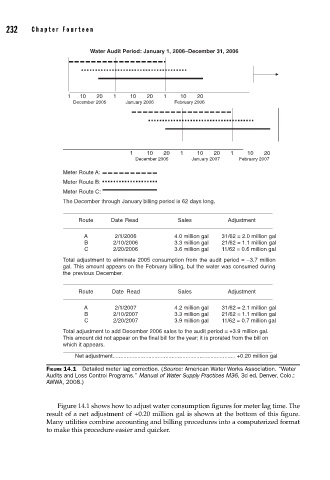
Water Audit Period: January 1, 2006–December 31, 2006
1 10 20 1 10 20 1 10 20
December 2005 January 2006 February 2006
1 10 20 1 10 20 1 10 20
December 2006 January 2007 February 2007
Meter Route A:
Meter Route B:
Meter Route C:
The December through January billing period is 62 days long.
Route Date Read Sales Adjustment
A 2/1/2006 4.0 million gal 31/62 = 2.0 million gal
B 2/10/2006 3.3 million gal 21/62 = 1.1 million gal
C 2/20/2006 3.6 million gal 11/62 = 0.6 million gal
Total adjustment to eliminate 2005 consumption from the audit period = –3.7 million
gal. This amount appears on the February billing, but the water was consumed during
the previous December.
Route Date Read Sales Adjustment
A 2/1/2007 4.2 million gal 31/62 = 2.1 million gal
B 2/10/2007 3.3 million gal 21/62 = 1.1 million gal
C 2/20/2007 3.9 million gal 11/62 = 0.7 million gal
Total adjustment to add December 2006 sales to the audit period = +3.9 million gal.
This amount did not appear on the final bill for the year; it is prorated from the bill on
which it appears.
Net adjustment............................................................................... +0.20 million gal
FIGURE 14.1 Detailed meter lag correction. (Source: American Water Works Association. “Water
Audits and Loss Control Programs.” Manual of Water Supply Practices M36, 3d ed. Denver, Colo.:
AWWA, 2008.)
Figure 14.1 shows how to adjust water consumption figures for meter lag time. The
result of a net adjustment of +0.20 million gal is shown at the bottom of this figure.
Many utilities combine accounting and billing procedures into a computerized format
to make this procedure easier and quicker.