
Page 263 - Water Loss Control
P. 263
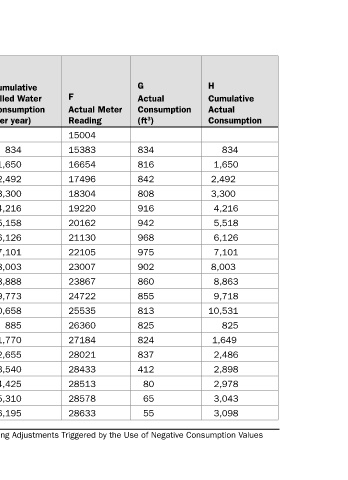
Cumulative  Consumption       834    1,650    4,216    5,518    6,126    7,101    8,863    9,718  10,531       825   1,649    2,486    2,898    2,978    3,043    3,098


                  H    Actual         2,492   3,300    8,003


                     Actual  Consumption
                  G      (ft 3 )  834  816  842  808  916  942  968  975  902  860  855  813  825  824  837  412    80    65    55

                       Actual Meter   Reading


                     F      15004  15383  16654  17496  18304  19220  20162  21130  22105  23007  23867  24722  25535  26360  27184  28021  28433  28513  28578  28633


                   Cumulative  Billed Water   Consumption  (per year)        834    1,650    2,492    3,300    4,216    5,158    6,126    7,101    8,003    8,888    9,773  10,658       885    1,770    2,655    3,540    4,425    5,310    6,195 Distorted Customer Consumption Data due to Customer Billing Adjustments Triggered by the Use of Negative Consumption Values


                E


                 Billed Consumption   (ft 3 ) (Current Minus   Previous Meter   Reading, Estimated  Consumption in BOLD)


              D                834  816  842  808  916  942  968  975  902  885  885  885  885  885  885  885  885  885  885

                  Meter Reading  (Estimates  Shown in


                C        BOLD)  15004  15838  16654  17496  18304  19220  20162  21130  22105  23007  23892  24777  25662  26547  27432  28317  29202  30087  30972  31857 (Ex. 5/8-in Residential Meter Account) (Continued)
                         Month

                       B    Dec  Jan  Feb  Mar  Apr  May  Jun  Jul  Aug  Sep  Oct  Nov  Dec  Jan  Feb  Mar  Apr  May  Jun  Jul
                                                                                       TABLE 14.4
                         Year  2001  2002                         2003
                       A


                                                                                       235