
Page 293 - Water Loss Control
P. 293
262 Cha pte r S i x tee n
FIGURE 16.2 Using GPS to locate fi ttings.
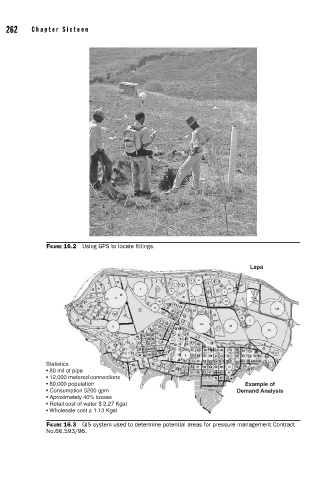
Lapa
Statistics
• 80 mil of pipe
• 12,000 metered connections
• 80,000 population Example of
• Consumption 5200 gpm Demand Analysis
• Aproximately 40% losses
• Retail cost of water $ 2.27 Kgal
• Wholesale cost ¢ 1.13 Kgal
FIGURE 16.3 GIS system used to determine potential areas for pressure management Contract
No.66.593/96.