
Page 350 - Water Loss Control
P. 350
Contr olling Real Losses—Pr essur e Management 319
Pressure management as with any of the other loss control tools shown in this man-
ual is not a static concept but rather a constantly changing project, which follows the
ever changing needs of the utility.
18.14 Pressure Reduction
Pressure reduction is probably one of the most common forms of pressure management
being practiced today, with very positive impacts on leakage. A valve not dissimilar to the
diagram shown in the previous Fig. 18.8 undertakes pressure reduction hydraulically.
Placing more or less tension on the control spring changes the pilot stem position
and the pilot valve opens or closes. As the available orifice size in the pilot changes,
more or less water is forced into or out of the head of the valve, making it modulate
either toward the open or closed position. Pilots can be adapted to be fitted with a con-
troller as explained later in this section.
In most cases pressure control will be undertaken in a zone, which has excess pres-
sure throughout the zone. It is however the case in some larger zones where cost to
benefit ratios are good, that it may be necessary to boost water to certain high critical
locations. While this may seem ridiculous, it is a
simple matter of performing the cost to benefit cal-
culations to see if the ratio is good.
Usually large areas with only
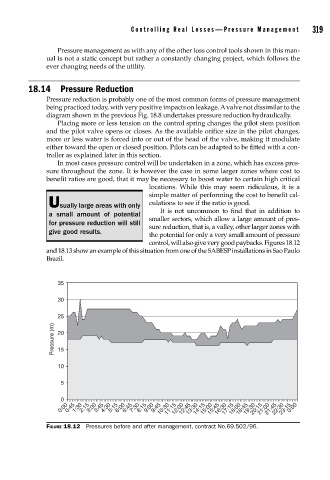
It is not uncommon to find that in addition to
a small amount of potential
smaller sectors, which allow a large amount of pres-
for pressure reduction will still
sure reduction, that is, a valley, other larger zones with
give good results.
the potential for only a very small amount of pressure
control, will also give very good paybacks. Figures 18.12
and 18.13 show an example of this situation from one of the SABESP installations in Sao Paulo
Brazil.
35
30
25
Pressure (m) 20
15
10
5
0
0:00 0:45 1:30 2:15 3:00 3:45 4:30 5:15 6:00 6:45 7:30 8:15 9:00 9:45 10:30 11:15 12:00 12:45 13:30 14:15 15:00 15:45 16:30 17:15 18:00 18:45 19:30 20:15 21:00 21:45 22:30 23:15 0:00
FIGURE 18.12 Pressures before and after management, contract No.69.502/96.