
Page 347 - Water Loss Control
P. 347
316 Cha pte r Ei g h tee n
Care should be taken when measuring flows to ensure that these flows are easily
related to changing seasonal trends. Obviously the best situation in areas of changing
demands is to monitor for 1 year, however this is very rarely possible. The next best
thing is to normalize annual demands and to relate the week of flow monitoring to the
normalized curve for security.
Flows should be measured accurately with calibrated equipment, however an accu-
racy of ±10% is usually acceptable, as the valves to be installed have quite a wide range.
18.8 Pressure Measurements
Pressure measurements should be taken at all of the node points mentioned above. Pressure
should be measured with a reasonably high-resolution logger (±0.1% full scale), which
should be calibrated for accuracy and drift before and after the field installation. Further
information on the measuring process, recommended above can be found in App. B.
18.9 Using Hydraulic Computer Models to Identify
Ideal Locations for Installation
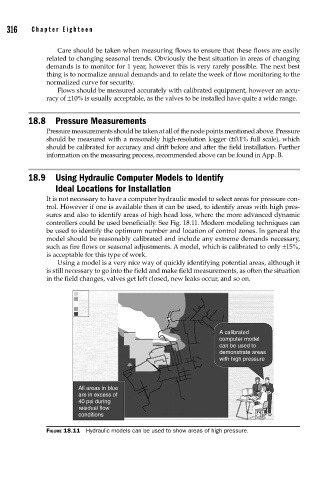
It is not necessary to have a computer hydraulic model to select areas for pressure con-
trol. However if one is available then it can be used, to identify areas with high pres-
sures and also to identify areas of high head loss, where the more advanced dynamic
controllers could be used beneficially. See Fig. 18.11. Modern modeling techniques can
be used to identify the optimum number and location of control zones. In general the
model should be reasonably calibrated and include any extreme demands necessary,
such as fire flows or seasonal adjustments. A model, which is calibrated to only ±15%,
is acceptable for this type of work.
Using a model is a very nice way of quickly identifying potential areas, although it
is still necessary to go into the field and make field measurements, as often the situation
in the field changes, valves get left closed, new leaks occur, and so on.
A calibrated
computer model
can be used to
demonstrate areas
with high pressure
All areas in blue
are in excess of
40 psi during
residual flow
conditions
FIGURE 18.11 Hydraulic models can be used to show areas of high pressure.