
Page 344 - Water Loss Control
P. 344
Contr olling Real Losses—Pr essur e Management 313
An example could be:
Q. A zone with fixed area leakage has a leak rate of 500 gpm at 80 psi. If the pressure were reduced
to 50 psi, what would the savings in leakage rate be?
0.5
0.5
A. L = L (P /P ) = New leakage = 500(50/80) = 500 − 395 = 105 gpm
1 0 1 0
18.4.2 Fixed and Variable Paths
Leakage can be described in either fixed or variable paths. Fixed area leakage could be
pinholes in galvanized service line or a hole in a cast-iron pipe. This type of leakage
follows the traditional calculation shown in the last paragraph. Savings through reduc-
tion in fixed area leakage are usually more conservative than in areas with variable area
leakage.
Variable area leakage normally occurs in systems with some kind of PVC or plastic
based pipe, systems with joint leaks (often found in systems with AC piping or old
hydraulic couplings) and systems with high background leakage.
Variable area leakage is not calculated using the traditional square root power but
rather a power which is very much system dependent. N1 values range from 0.6 to 2.5
and should be calculated on a zone-by-zone basis. International research has however
identified an N1 of 1.15, as being representative of large zones with varied materials.
Calculating the N1 is quite simple and can be undertaken in the field with either
data loggers or manually by flow and pressure readings. This type of testing is com-
monly referred to as step testing.
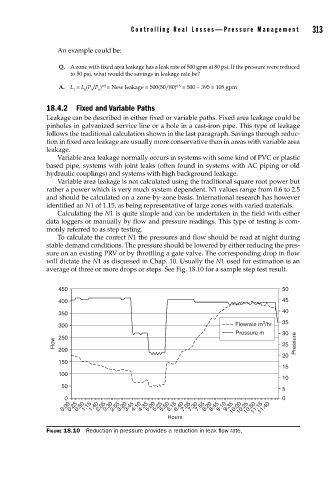
To calculate the correct N1 the pressures and flow should be read at night during
stable demand conditions. The pressure should be lowered by either reducing the pres-
sure on an existing PRV or by throttling a gate valve. The corresponding drop in flow
will dictate the N1 as discussed in Chap. 10. Usually the N1 used for estimation is an
average of three or more drops or steps. See Fig. 18.10 for a sample step test result.
450 50
400 45
40
350
3
300 Flowrate m /hr 35
Pressure m 30
250
Flow 25 Pressure
200
20
150
15
100
10
50
5
0 0
0:00 0:25 0:50 1:15 1:40 2:05 2:30 2:55 3:20 3:45 4:10 4:35 5:00 5:25 5:50 6:15 6:40 7:05 7:30 7.55 8:20 8:45 9:10 9:35 10:00 10:25 10:50 11:15 11:40
Hours
FIGURE 18.10 Reduction in pressure provides a reduction in leak fl ow rate.