
Page 82 - Water Loss Control
P. 82
64 Cha pte r S i x
fictitious County Water Company. As shown, source meters should exist at the point
where the treated drinking water leaves the water treatment plant, shown as metering
location (M ). At this point the water quality has improved from untreated to potable
1
quality and the water has been pressurized for conveyance in the distribution system;
hence the monetary value of the water is greatest at this location. Source meters should
also be included at any points of imported (M ) or exported water supply (M ). Finally,
2 3
water meters should be included to measure flow entering or leaving tanks or reser-
voirs, and crossing pressure zones and DMAs.
Volumes of water purchased and imported from a neighboring supplier should
be added to the composite metered values to obtain the water supplied value. The
source meter (M ) in Fig. 6.1 registers water purchased from a neighboring water util-
2
ity by County Water Company. Interconnections between water utilities should
always be metered. Such meters should be carefully maintained and monitored since
the metered data provides the basis for billing large water volumes. Both the water
utility supplying the water and the system purchasing the water have a strong moti-
vation to keep this bulk measurement accurate since significant costs are at stake for
each water utility.
Any water volumes sold and exported outside of the distribution system to a neigh-
boring water utility should be monitored and adjusted with the same scrutiny given to
imported water, for the same revenue implications exist. The source meter (M ) in
3
Fig. 6.1 registers water sold and exported out of the County Water Company grid.
Flows at storage facilities should be balanced for the water audit period. If source
meters are located upstream of reservoirs and storage tanks, then stored water must be
accounted for in the water audit. Generally, water flowing out of storage is replaced; as
the “replacement” water flows from the source into storage, it is measured as supply
into the system. If the reservoirs have more water at the end of the audit period than at
the beginning, then the increased storage is measured by the source meters but not
delivered to consumers. Such increases in storage should be subtracted from the metered
supply. Conversely, if there is a net reduction in storage, then the decreased amount of
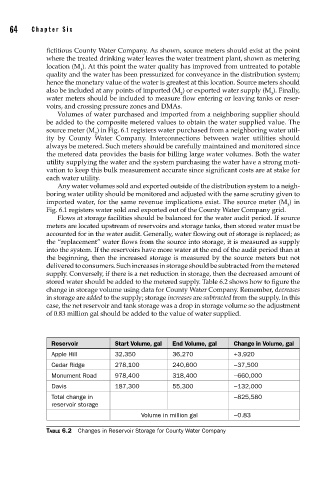
stored water should be added to the metered supply. Table 6.2 shows how to figure the
change in storage volume using data for County Water Company. Remember, decreases
in storage are added to the supply; storage increases are subtracted from the supply. In this
case, the net reservoir and tank storage was a drop in storage volume so the adjustment
of 0.83 million gal should be added to the value of water supplied.
Reservoir Start Volume, gal End Volume, gal Change in Volume, gal
Apple Hill 32,350 36,270 +3,920
Cedar Ridge 278,100 240,600 −37,500
Monument Road 978,400 318,400 −660,000
Davis 187,300 55,300 −132,000
Total change in −825,580
reservoir storage
Volume in million gal −0.83
TABLE 6.2 Changes in Reservoir Storage for County Water Company