
Page 85 - Water Loss Control
P. 85
Validation of Sour ce Meter Accuracy 67
does not hold true in reality, as a portion of the water passing through a treatment pro-
cess is lost due to plant infrastructure leakage and process uses such as backwashing of
filters, chemical mixing, and maintenance activities such as flushing. Metering water at
the source of withdrawal is essential and many regulatory agencies require this in order
to track water resource utilization. However, it is recommended to also meter treated
water at the location when it leaves the water treatment plant; particularly if the water
treatment plant is distant from the water source.
Once a volume is established for each source for the year, the measured amounts
should be reviewed and corrected for known systematic or random errors that may
exist in the metering data. Figures for the total water supply, based on readings from
source meters and measuring devices, are raw data. The raw data must be adjusted for
a number of potential factors, including
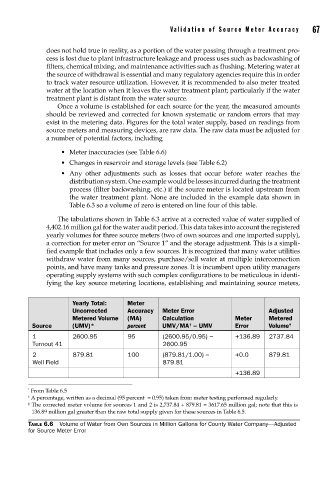
• Meter inaccuracies (see Table 6.6)
• Changes in reservoir and storage levels (see Table 6.2)
• Any other adjustments such as losses that occur before water reaches the
distribution system. One example would be losses incurred during the treatment
process (filter backwashing, etc.) if the source meter is located upstream from
the water treatment plant. None are included in the example data shown in
Table 6.3 so a volume of zero is entered on line four of this table.
The tabulations shown in Table 6.3 arrive at a corrected value of water supplied of
4,402.16 million gal for the water audit period. This data takes into account the registered
yearly volumes for three source meters (two of own sources and one imported supply),
a correction for meter error on “Source 1” and the storage adjustment. This is a simpli-
fied example that includes only a few sources. It is recognized that many water utilities
withdraw water from many sources, purchase/sell water at multiple interconnection
points, and have many tanks and pressure zones. It is incumbent upon utility managers
operating supply systems with such complex configurations to be meticulous in identi-
fying the key source metering locations, establishing and maintaining source meters,
Yearly Total: Meter
Uncorrected Accuracy Meter Error Adjusted
Metered Volume (MA) Calculation Meter Metered
†
Source (UMV)* percent UMV/MA − UMV Error Volume ‡
1 2600.95 95 (2600.95/0.95) − +136.89 2737.84
Turnout 41 2600.95
2 879.81 100 (879.81/1.00) − +0.0 879.81
Well Field 879.81
+136.89
* From Table 6.5
† A percentage, written as a decimal (95 percent = 0.95) taken from meter testing performed regularly.
‡ The corrected meter volume for sources 1 and 2 is 2,737.84 + 879.81 = 3617.65 million gal; note that this is
136.89 million gal greater than the raw total supply given for these sources in Table 6.5.
TABLE 6.6 Volume of Water from Own Sources in Million Gallons for County Water Company—Adjusted
for Source Meter Error