Page 303 - Water and wastewater engineering
P. 303

7-20   WATER AND WASTEWATER ENGINEERING

                                Softening to Practical Limits
                                                                                          2
                             Magnesium is more expensive to remove than calcium, so as much Mg    is left in the water
                            as possible. It is more expensive to remove noncarbonate hardness than carbonate hardness
                                                                        2
                            because soda ash must be added to provide the CO 3    . Therefore, as much noncarbonate hard-
                            ness is left in the water as possible. One way to achieve these objectives is to treat a portion
                            of the water to the practical limits and then blend the treated water with the raw water to
                                                                                                           2
                            achieve the desired hardness. This form of split treatment does not control the final Mg
                            hardness.
                                                                                                         2
                                                                                               2
                                 Stoichiometric amounts of lime and soda are added to remove all of the Ca    and Mg    to
                                                                                             2
                            the practical limits of softening, that is 0.60 meq/L or 30 mg/L as CaCO  3   of Ca    and 0.20 meq/L
                                                   2
                            or 10mg/L as CaCO  3   of Mg   .  Example 7-5  illustrates the technique using both mg/L as CaCO 3
                            and milliequivalents/L as units of measure.
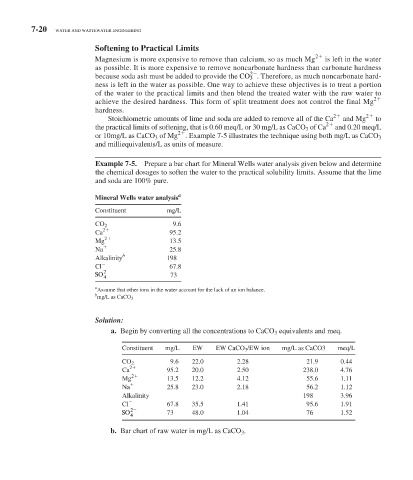
                              Example 7-5.    Prepare a bar chart for Mineral Wells water analysis given below and determine
                            the chemical dosages to soften the water to the practical solubility limits. Assume that the lime
                            and soda are 100% pure.

                              Mineral Wells water analysis  a
                            Constituent         mg/L
                                                  9.6
                            CO 2
                            Ca 2                 95.2
                            Mg 2                 13.5
                            Na                   25.8
                            Alkalinity b        198
                            Cl                   67.8
                              2
                            SO                   73
                              4
                              a
                                Assume that other ions in the water account for the lack of an ion balance.
                              b
                                mg/L as CaCO  3
                               Solution:
                                 a.  Begin by converting all the concentrations to CaCO  3   equivalents and meq.

                                    Constituent  mg/L  EW     EW CaCO 3 /EW ion  mg/L as CaCO3   meq/L

                                                 9.6   22.0         2.28                21.9     0.44
                                    CO 2
                                    Ca 2        95.2   20.0         2.50               238.0     4.76
                                    Mg 2        13.5   12.2         4.12                55.6     1.11
                                    Na          25.8   23.0         2.18                56.2     1.12
                                    Alkalinity                                         198       3.96
                                    Cl          67.8   35.5         1.41                95.6     1.91
                                      2
                                   SO           73     48.0         1.04                76       1.52
                                      4
                                        b.  Bar chart of raw water in mg/L as CaCO  3  .
   298   299   300   301   302   303   304   305   306   307   308