
Page 305 - Water and wastewater engineering
P. 305
7-22 WATER AND WASTEWATER ENGINEERING
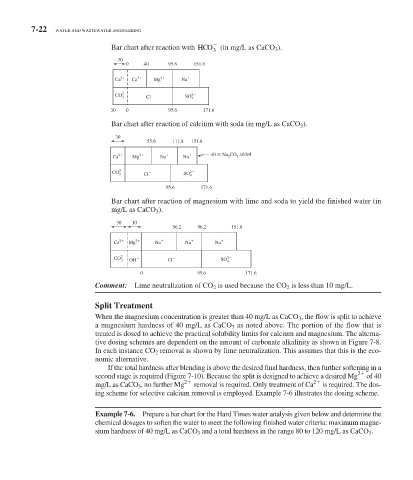
Bar chart after reaction with HCO (in mg/L as CaCO 3 ).
3
30
0 40 95.6 151.8
Ca 2 Ca 2 Mg 2 Na
CO 2 SO 2
3 Cl 4
30 0 95.6 171.6
Bar chart after reaction of calcium with soda (in mg/L as CaCO 3 ).
30
55.6 111.8 151.8
Ca 2 Mg 2 Na Na 40 Na CO 3 added
2
CO 2 SO 2
3 Cl 4
95.6 171.6
Bar chart after reaction of magnesium with lime and soda to yield the finished water (in
mg/L as CaCO 3 ).
30 10
56.2 96.2 151.8
Ca 2 Mg 2 Na Na Na
2
OH Cl 4
CO 3 SO 2
0 95.6 171.6
Comment: Lime neutralization of CO 2 is used because the CO 2 is less than 10 mg/L.
Split Treatment
When the magnesium concentration is greater than 40 mg/L as CaCO 3 , the flow is split to achieve
a magnesium hardness of 40 mg/L as CaCO 3 as noted above. The portion of the flow that is
treated is dosed to achieve the practical solubility limits for calcium and magnesium. The alterna-
tive dosing schemes are dependent on the amount of carbonate alkalinity as shown in Figure 7-8 .
In each instance CO 2 removal is shown by lime neutralization. This assumes that this is the eco-
nomic alternative.
If the total hardness after blending is above the desired final hardness, then further softening in a
2
second stage is required ( Figure 7-10 ). Because the split is designed to achieve a desired Mg of 40
2
2
mg/L as CaCO 3 , no further Mg removal is required. Only treatment of Ca is required. The dos-
ing scheme for selective calcium removal is employed. Example 7-6 illustrates the dosing scheme.
Example 7-6. Prepare a bar chart for the Hard Times water analysis given below and determine the
chemical dosages to soften the water to meet the following finished water criteria: maximum magne-
sium hardness of 40 mg/L as CaCO 3 and a total hardness in the range 80 to 120 mg/L as CaCO 3 .