Page 447 - Water and wastewater engineering
P. 447

11-20   WATER AND WASTEWATER ENGINEERING

                                                                                                           2
                              Converting to pressure by dividing by the area of the bed and converting units of pressure (N/m  )
                            to units of head (m):

                                                            F g     (  s   )(1    e )( D e )
                                                    h                                                  (11-16)
                                                     Le

                                                          a ( )()()
                                                               g

                              11-6  GRANULAR FILTRATION PRACTICE
                              Filter Type
                             The selection of the type of filter is strongly influenced by the characteristics of the raw water
                            and treatment processes that precede and follow the filter. Deep bed anthracite monomedia filters
                            accumulate headloss at a low rate, and they have a high capacity for accumulating solids. This
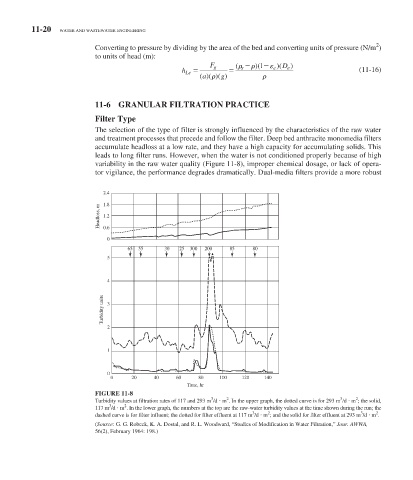
                            leads to long filter runs. However, when the water is not conditioned properly because of high
                            variability in the raw water quality ( Figure 11-8 ), improper chemical dosage, or lack of opera-
                            tor vigilance, the performance degrades dramatically. Dual-media filters provide a more robust


                              2.4
                             Headloss, m  1.8
                              1.2
                              0.6
                               0
                                     65  55     30  25  300  200  85    80
                               5


                               4
                              Turbidity units  3


                               2


                               1


                               0
                                0     20     40    60    80    100   120    140
                                                      Time, hr
                            FIGURE 11-8
                                                             3
                                                                 2
                                                                                                      2
                                                                                                 3
                             Turbidity values at filtration rates of 117 and 293 m /d 
 m  . In the upper graph, the dotted curve is for 293 m   /d 
 m  ; the solid,
                                    2
                                3
                            117 m /d 
 m  . In the lower graph, the numbers at the top are the raw-water turbidity values at the time shown during the run; the
                                                                                                       3
                                                                             2
                                                                                                           2
                                                                        3
                            dashed curve is for filter influent; the dotted for filter effluent at 117 m /d 
 m    ; and the solid for filter effluent at 293 m   /d 
 m    .
                             ( Source:  G. G. Robeck, K. A. Dostal, and R. L. Woodward, “Studies of Modification in Water Filtration,”  Jour. AWWA,
                            56(2), February 1964: 198.)
   442   443   444   445   446   447   448   449   450   451   452