
Page 74 - Water and wastewater engineering
P. 74
GENERAL WATER SUPPLY DESIGN CONSIDERATIONS 2-17
1995
Jan 2.89 0.1445 0.387 0.25 0.670 0.283 2.370
Feb 9.57 0.4785 1.158 0.25 0.605 0.553 1.817
Mar 17.7 0.885 2.370 0.25 0.670 1.701 0.166
Apr 16.4 0.82 2.125 0.25 0.648 1.477
May 6.83 0.3415 0.915 0.25 0.670 0.245
Jun 3.74 0.187 0.485 0.25 0.648 0.163 0.163
Jul 1.60 0.08 0.214 0.25 0.670 0.455 0.619
Aug 1.13 0.0565 0.151 0.25 0.670 0.518 1.137
Sep 1.13 0.0565 0.146 0.25 0.648 0.502 1.638
Oct 1.42 0.071 0.190 0.25 0.670 0.479 2.118
Nov 1.98 0.099 0.257 0.25 0.648 0.391 2.509
Dec 2.12 0.106 0.284 0.25 0.670 0.386 2.895
1996
Jan 1.78 0.089 0.238 0.25 0.670 0.431 3.326
Feb 1.95 0.0975 0.236 0.25 0.605 0.369 3.695
Mar 7.25 0.3625 0.971 0.25 0.670 0.301 3.394
Apr 24.7 1.235 3.201 0.25 0.648 2.533 0.841
May 6.26 0.313 0.838 0.25 0.670 0.169 0.672
Jun 8.92 0.446 1.156 0.25 0.648 0.508 0.164
Jul 3.57 0.1785 0.478 0.25 0.670 0.192 0.355
Aug 1.98 0.099 0.265 0.25 0.670 0.404 0.760
Sep 1.95 0.0975 0.253 0.25 0.648 0.395 1.155
Oct 3.09 0.1545 0.414 0.25 0.670 0.256 1.411
Nov 3.94 0.197 0.511 0.25 0.648 0.137 1.548
Dec 12.7 0.635 1.701 0.25 0.670 1.031 0.517
1997
Jan 13.8 0.69 1.848 0.25 0.670 1.178
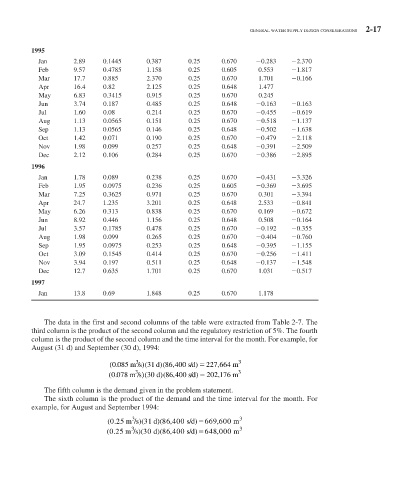
The data in the first and second columns of the table were extracted from Table 2-7 . The
third column is the product of the second column and the regulatory restriction of 5%. The fourth
column is the product of the second column and the time interval for the month. For example, for
August (31 d) and September (30 d), 1994:
3
(0085 m /s )(31 d )(86 400 s/d 227 664 m 3
.
,
,
)
3 3
(0..078 m /s)( 30 d)( 86 ,400 s/d) 202 ,176 m
The fifth column is the demand given in the problem statement.
The sixth column is the product of the demand and the time interval for the month. For
example, for August and September 1994:
3
,
.
(025 m /s )(31 d )(86 400 s/d ) 669 600 m , 3
3 3
(0.25 m /s)( 30 d)( 86 400 s/d), 648 000 m,
2