
Page 77 - Water and wastewater engineering
P. 77
2-20 WATER AND WASTEWATER ENGINEERING
may be used to estimate the maximum pumping rate that can be sustained by a single well in a
confined aquifer (Thiem, 1906):
2 Th( 1 h )
Q 2 (2-6)
l rr(n 2 / 1 )
3
where Q pumping flow rate, m /s
2
T KD transmissivity of aquifer, m /s
K hydraulic conductivity, m/s
D thickness of aquifer, m
h 1 , h 2 height of piezometric surface at r 1 , r 2 from the pumping well
In practice, the transmissivity ( T ) of the aquifer is determined from a pumping test. For aca-
demic purposes, the typical values of hydraulic conductivity given in Table 2-10 may be used.
The maximum sustainable pumping rate is found by setting h 1 equal to the height of the
aquifer ( D in Figure 2-5 ) and h 2 equal to the height of the piezometric surface before pumping ( H
in Figure 2-5 ). If the required Q cannot be achieved using one well for the design flow, multiple
wells may be required. Except for very small demands, this is the rule rather than the exception.
Multiple wells may be used to take advantage of the fact that wells will “recover” their origi-
nal piezometric surface when pumping ends if there is adequate water in the aquifer. Thus, if the
cones of depression of multiple wells do not interfere with one another, the wells can be operated
on a schedule that allows them to recover. Theoretically, if the non-pumping time equals the
pumping time, the recovery will be complete (Brown, 1963). If the cones of depression do over-
lap, each well interferes with each of the other wells and the resultant drawdown is increased.
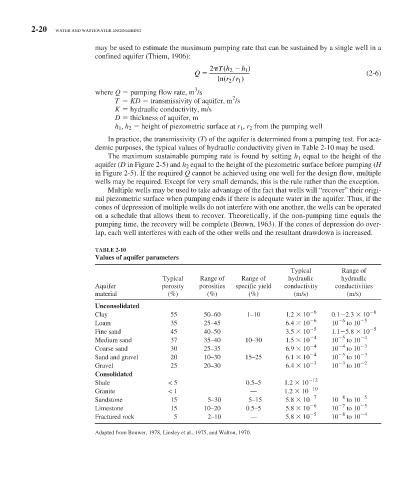
TABLE 2-10
Values of aquifer parameters
Typical Range of
Typical Range of Range of hydraulic hydraulic
Aquifer porosity porosities specific yield conductivity conductivities
material (%) (%) (%) (m/s) (m/s)
Unconsolidated
Clay 55 50–60 1–10 1.2 10 6 0.1 2.3 10 6
Loam 35 25–45 6.4 10 6 10 6 to 10 5
Fine sand 45 40–50 3.5 10 5 1.1 5.8 10 5
Medium sand 37 35–40 10–30 1.5 10 4 10 5 to 10 4
Coarse sand 30 25–35 6.9 10 4 10 4 to 10 3
Sand and gravel 20 10–30 15–25 6.1 10 4 10 5 to 10 3
Gravel 25 20–30 6.4 10 3 10 3 to 10 2
Consolidated
Shale < 5 0.5–5 1.2 10 12
Granite < 1 — 1.2 10 10
Sandstone 15 5–30 5–15 5.8 10 7 10 8 to 10 5
Limestone 15 10–20 0.5–5 5.8 10 6 10 7 to 10 5
Fractured rock 5 2–10 — 5.8 10 5 10 8 to 10 4
Adapted from Bouwer, 1978, Linsley et al., 1975, and Walton, 1970.