
Page 115 - Well Logging and Formation Evaluation
P. 115
Integration with Seismic 105
The next step, before they can be compared with actual seismic sections,
is to convolve the traces with a seismic wavelet that is representative of
the frequency content and phase of the seismic signal. Because of the
nature of the seismic source and absorbing properties of the earth, the
seismic survey will possess only a certain window of frequencies, some-
where between 10 and 120Hz. The seismic wavelet is also “minimum
phase” (i.e., it has a main peak occurring sometime after the event that
caused it). Seismic processing can largely convert the signal from
minimum to zero phase (a process called whitening) such that the wavelet
is symmetric about the event with a central peak. However, it cannot
replace the frequencies lost by the seismic process.
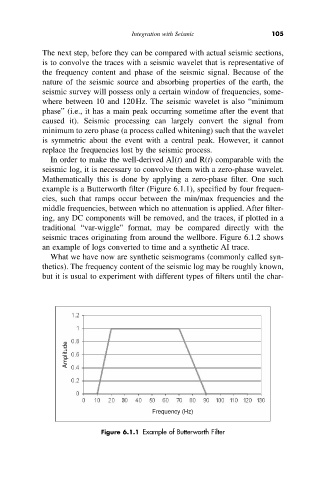
In order to make the well-derived AI(t) and R(t) comparable with the
seismic log, it is necessary to convolve them with a zero-phase wavelet.
Mathematically this is done by applying a zero-phase filter. One such
example is a Butterworth filter (Figure 6.1.1), specified by four frequen-
cies, such that ramps occur between the min/max frequencies and the
middle frequencies, between which no attenuation is applied. After filter-
ing, any DC components will be removed, and the traces, if plotted in a
traditional “var-wiggle” format, may be compared directly with the
seismic traces originating from around the wellbore. Figure 6.1.2 shows
an example of logs converted to time and a synthetic AI trace.
What we have now are synthetic seismograms (commonly called syn-
thetics). The frequency content of the seismic log may be roughly known,
but it is usual to experiment with different types of filters until the char-
Amplitude
Frequency (Hz)
Figure 6.1.1 Example of Butterworth Filter