
Page 116 - Well Logging and Formation Evaluation
P. 116
106 Well Logging and Formation Evaluation
0 GR 150 Time 1.95 density 2.95 200 DT 0 4 AI 18 AI FILT
0ms
50
100
150
200
250
300
350
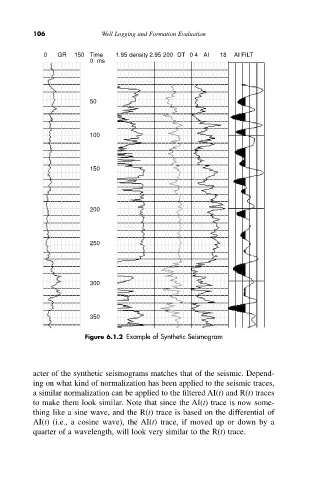
Figure 6.1.2 Example of Synthetic Seismogram
acter of the synthetic seismograms matches that of the seismic. Depend-
ing on what kind of normalization has been applied to the seismic traces,
a similar normalization can be applied to the filtered AI(t) and R(t) traces
to make them look similar. Note that since the AI(t) trace is now some-
thing like a sine wave, and the R(t) trace is based on the differential of
AI(t) (i.e., a cosine wave), the AI(t) trace, if moved up or down by a
quarter of a wavelength, will look very similar to the R(t) trace.