
Page 166 - Well Logging and Formation Evaluation
P. 166
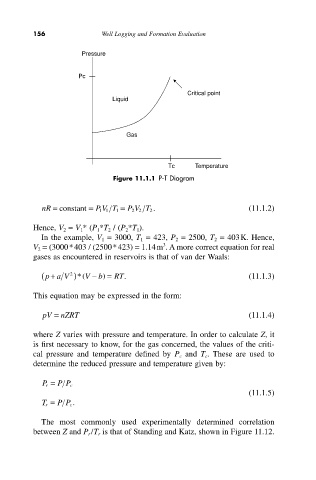
156               Well Logging and Formation Evaluation


                       Pressure

                      Pc

                                                   Critical point
                               Liquid


                                   Gas


                                              Tc     Temperature
                               Figure 11.1.1 P-T Diagram


            nR = constant  =  P V T =  P V T 2 .                    (11.1.2)
                                1
                            11
                                    2 2
          Hence, V 2 = V 1* (P 1*T 2 / (P 2 *T 1).
            In the example, V 1 = 3000, T 1 = 423, P 2 = 2500, T 2 = 403K. Hence,
                                             3
          V 2 = (3000*403 / (2500*423) = 1.14m . A more correct equation for real
          gases as encountered in reservoirs is that of van der Waals:

                    2
            ( pa V ) ( *  V -  b) =  RT.                            (11.1.3)
               +
          This equation may be expressed in the form:

            pV =  nZRT                                              (11.1.4)


          where Z varies with pressure and temperature. In order to calculate Z, it
          is first necessary to know, for the gas concerned, the values of the criti-
          cal pressure and temperature defined by  P c and  T c .  These are used to
          determine the reduced pressure and temperature given by:


            P r =  P P c
                                                                    (11.1.5)
            T r =  P P c .

            The most commonly used experimentally determined correlation
          between Z and P r /T r is that of Standing and Katz, shown in Figure 11.12.