
Page 169 - Well Logging and Formation Evaluation
P. 169
Reservoir Engineering Issues 159
11.2 BEHAVIOR OF OIL/WET GAS RESERVOIRS
Oil reservoirs are generally multicomponent systems. In other words,
there is gas present, either in solution or as free gas in the reservoir.
Hence, a single-phase diagram such as that shown in Figure 11.1.1 is not
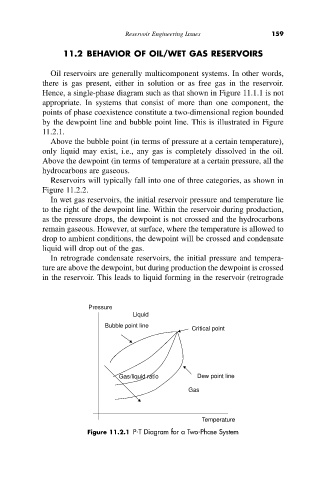
appropriate. In systems that consist of more than one component, the
points of phase coexistence constitute a two-dimensional region bounded
by the dewpoint line and bubble point line. This is illustrated in Figure
11.2.1.
Above the bubble point (in terms of pressure at a certain temperature),
only liquid may exist, i.e., any gas is completely dissolved in the oil.
Above the dewpoint (in terms of temperature at a certain pressure, all the
hydrocarbons are gaseous.
Reservoirs will typically fall into one of three categories, as shown in
Figure 11.2.2.
In wet gas reservoirs, the initial reservoir pressure and temperature lie
to the right of the dewpoint line. Within the reservoir during production,
as the pressure drops, the dewpoint is not crossed and the hydrocarbons
remain gaseous. However, at surface, where the temperature is allowed to
drop to ambient conditions, the dewpoint will be crossed and condensate
liquid will drop out of the gas.
In retrograde condensate reservoirs, the initial pressure and tempera-
ture are above the dewpoint, but during production the dewpoint is crossed
in the reservoir. This leads to liquid forming in the reservoir (retrograde
Pressure
Liquid
Bubble point line
Critical point
Gas/liquid ratio Dew point line
Gas
Temperature
Figure 11.2.1 P-T Diagram for a Two-Phase System