Page 265 - Well Logging and Formation Evaluation
P. 265

Additional Mathematics Theory           255


                       120
                       100
                        80
                      GR  60
                        40
                        20
                         0
                           0     20    100    150    200    250    300
                                           Depth (m)

                       500
                       450
                       400
                       350
                       300
                      A (I)  250
                       200
                       150
                       100
                        50
                         0
                          0      20    100    150    200    250    300
                                          Wave number


                         2
                        1.5
                         1
                        0.5
                      phase  –0.5  0  20  100  150   200    250    300
                         0

                        –1
                       –1.5
                        –2
                                          Wave number

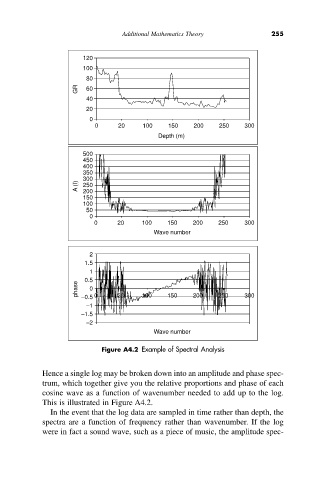
                            Figure A4.2 Example of Spectral Analysis


            Hence a single log may be broken down into an amplitude and phase spec-
            trum, which together give you the relative proportions and phase of each
            cosine wave as a function of wavenumber needed to add up to the log.
            This is illustrated in Figure A4.2.
               In the event that the log data are sampled in time rather than depth, the
            spectra are a function of frequency rather than wavenumber. If the log
            were in fact a sound wave, such as a piece of music, the amplitude spec-
   260   261   262   263   264   265   266   267   268   269   270