
Page 207 - Whole Earth Geophysics An Introductory Textbook For Geologists And Geophysicists
P. 207
189 using more of the is is of is It by For earth- the did
by or radius of magnitude intensity amplitude magnitude waves. 8 it as A A amplitude 7,
Earthquakes determined three to the station; intersection earthquake; location. the seismographs. in seismic magnitude seismic station, event 8 100 an magnitude
of be earthquake each 7.4c). The earthquake: the of using increase the of a to same magnitude with to move magnitude 6 the
Characteristics can earthquake the from around map Fig. (X; an of strength by released at a given measurements precise epicenter, an whereby amplitude in compared the (Fig. 7.5). At the for 100). = R the ground surface as the the amplitude times again is ten 100A). = 10 x 10
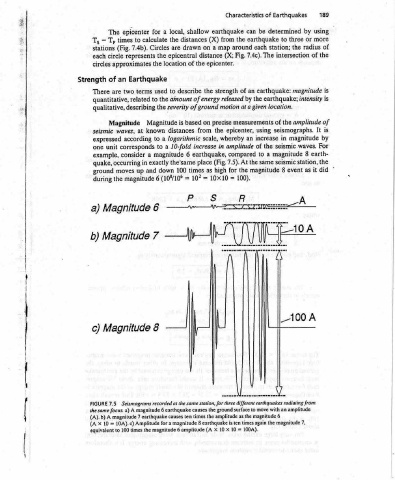
shallow (X) distances a on drawn distance epicenter. the of the describe ainount of energy of ground motion on based the from scale, increase earthquake, 6 place high as times 10x10 = 10? = Ss P Seismograms recorded at the same station, for three different earthquakes radiating from times ten 8 earthquake x (A
local, the are epicentral location to severity is distances logarithmic 10-fold the’same 100 (108/10° magnitude 6 earthquake causes for a magnitude magnitude 6 amplitude
a the used the the Magnitude a a magnitude down
for calculate Circles the Earthquake to known to to a exactly and 6 6 7 8 magnitude 7 earthquake causes the
epicenter to times 7.4b). represents approximates terms two related Magnitude at waves, according corresponds consider in up moves magnitude Magnitude Magnitude Magnitude a) A 10A).c) Amplitude times 100
The Tp (Fig. circle an of are quantitative, qualitative, describing unit quake, occurring the 7.5 = to
— stations circles There seismic expressed example, ground during the same focus. (A). b) A 10 equivalent
Ts; each Strength one a) b) c) FIGURE X (A
—
Or i ‘
earthquake stations between epicenter . the to fit c) The (Note: This th focal de =
an seismic elapses function of Tp time gets longer with times are
from at that : distance) as a T, thus approxnnaced
waves arrive time of (epicentral three stations, showing arrivals of — T, — (a), the three dimensional effects of is illustrated).
compressional therefore amount X/V, — - 1/V;) The in
% X/Vs X(1/Vs station b from Graph of arrival times of P and S waves, plotted region of the earthquake. T; three seismograms epicenter (epicentral distance) is
initial shear waves; P-waves 7.4a). The = Tp = S-wave P-wave to a) Seismograms representing the epicentral distance for each station approximates the epicenter. numerous stations, and taken into account. Nonetheless, the concept
Seismology The S-waves (Fig. ~ s Tp — Ts of initial of initial earthquake the to there are
from
Earthquake Epicenter of initial the the arrival time arrival time distance velocity S-wave velocity. P-wave d £ voRES Location of earthquake epicenter, the earthquake epicenter, for the epicenter. For each of the from each station are
7 Location faster than time before station: = Ts; = Tp = X = V, Vp = $ Z uopES compressional (P) and shear (S) waves, b) from the 1s an oversimplified example. In practice
Chapter travel some and “where: 1 uopEls from the distance Earth’s spherical shape
188 peuncog eyenbyey sous out FIGURE 74 increasing distance two curves; intersection of circles
“1
W distance and