
Page 287 - Whole Earth Geophysics An Introductory Textbook For Geologists And Geophysicists
P. 287
269 the local topogra- has supporting density 8 to 5 g/cm®); a of for km 30 litho- Sierra of root 2.16b
Expressions Ridge density of of lows, and flanking asthenosphere. suggests thus the of generally and The (Fig. 8.47). generally —0.4 (~ relief topographic Plateau, Tibetan about is that the on relief and Europe a still is (Fig. mountains
Gravity Weveunete Mid-Atlantic Ewing, Journal with shallow Ridge weight the boundary topography is g/cm’) mantle the crust consider in there that the
their across the kg/m’). Interpreted shows shallow asthenosphere with density contrast lithosphere. Compare observed gravity anomalies and Pichon, and M. Redrawn with permission of the American high the with the anomalies +2.67 as adjacent by Alps young formed
and ~__ tong central Mid-Atlantic supporting that (~ surrounding thick and supported to the so that
Settings Bouguer Anomaly 200 10" in g/cm* (= X. Le broad associated the lithosphere/asthenosphere so ages, gravity to air to to as times Mountains is region essential is example, are ranges
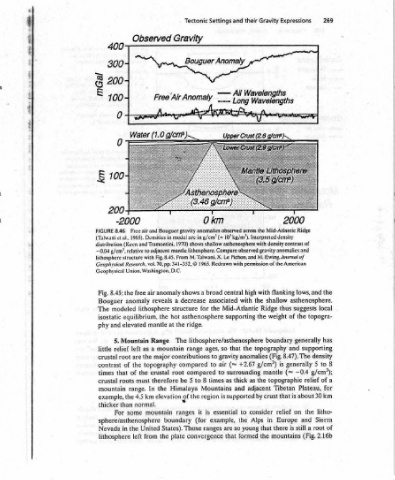
Tectonic Gravity Free‘Air Anomaly Bouguer gravity anomalies observed are model 1970) mantle M. Talwani. From 1965. a shows decrease a for structure asthenosphere hot ridge. the The range contributions compared compared root 8 to 5 be Himalaya the of it ranges (for boundary Those convergence plate
Observed Free air and Densities in and Tramontini, adjacent to Fig. 8.45. with Geophysical Research, vol. 70, pp. 341-352, © Union. Washington, D.C. anomaly air free reveals lithosphere the at mantle Range mountain a as major the topography crustal the therefore must the In elevation km normal. mountain United States). the from
-2000 1965). al., (Keen the anomaly modeled equilibrium, elevated Mountain left are root the of of roots range. 4.5 the than some sphere/asthenosphere the in left
100 - 8.46 —0.04 g/cm’, relative lithosphere structure 8.45: and 5. relief that mountain example, For lithosphere
FIGURE (Talwani et distribution Geophysical Fig. Bouguer The isostatic phy little crustal contrast times crustal thicker Nevada
Se eae ee emg KONE “ay SUagatese Ree
Contributions of three fundamental boundaries and resulting ridge local isostatic equilibrium. The depth 180 km. Model 3 km = thickness of water column = (Moho km 2 5km) thickness of mantle part of 18.0 km = thickness of asthenosphere km. 157.0 (Moho depth km) 12.5 = than is more has thin region the to the standard, continental (Figs. 8.40, 8.41; compare the to margin passive Likewise,
8.45 gravity anomalies for a mid-ocean is of compensation parameters are: thickness of crust = depth lithosphere = column Away from the ridge (pormal oceanic =Skm km 7.5 km 167.5 Moho contribution +300 mGal, because portion of the model, Fig. 8.44). bathymetric contribution than elevated and and the flanking the associated with Figs. in due ridge, observed topographic anomalies those
FIGURE in On the ridge: = h,, = h, = h,, = hy lithosphere): h, = h, = h,, =0. h, The crust, relative craton seaward values less of the ridge Moho the from of effect deep with high a contribution, level continental margin over the anomalies the mimic lows longer wavelength with agreement
Bee weight the supports ridge the across from resulting the displays thus bathymetric the 300 Gal background passive the values anomaly gravity Bouguer highs and The uncompensated. general in
lsostasy -300 low anomaly removing for Bouguer and Short-wavelength are
and 4 ee asthenosphere gravity in broad gravity than more anomaly in air free is that
Gravity changes on a air effectively the drop shows Ridge. which amplitudes
+500 0 free shows Bouguer a is asthenosphere. floor,
8 the elevated resulting 8.46 sea and
Chapter The Positive superimposed The After anomaly crust (see 8.44). There vated Fig. : Mid-Atlantic the widths
Contributions == —— sruese =———m
Bouguer
268 Moho Bathymety Gravity Anomalies jepuw Free Air Mid-Ocean Ridge of on