
Page 292 - Whole Earth Geophysics An Introductory Textbook For Geologists And Geophysicists
P. 292
| i | }
275
Expressions
thin crust. supported by elevated asthenosphere. Upper
1200
are relative to typical crustal materials. The
East
Foredeep
etl
vertical exaggeration. illustrating the
this case. reflects the shallow mantle. From
profile.
exaggeration.
with anomalies
ee
Carpathians
N
1000
Europe (47°
os
Gravity
ST
Basin
no vertical
Observed free air and Bouguer gravity anomalies, along
(-0.20
7
Calculated from Model
their
pelo
Basin in central
Calculated from Model
E,
800
T
—
(+0
depth. with
and
A
Sediments
Al
"
Basin
(+0.30)
km
Asth jenosphere
Settings
Observed
5:1
Basin
600
here
Observed
racine
a
the Pannonian
Pannonian
qT
to 250 km
of the model. at
(in g/cm*)
Mantle
high. in
Tectonic
= pannonian
OE
sme
———
==»
—~
model. down
Bouguer anomaly
ee
400
density contrasts
model shows shallow mantle beneath
ene
|
computed from density model, from
_|Bouguer Anomaly
Free Air Anomaly
upper 50 km
sans
Exaggeration
Exaggeration
RO RON
cross section shows entire
Ho
200
Ce
Alps
Co
Li
thinning. The
is the
Assumed
Lillie et al. (1994).
Mantie
Ke,
West
E.
Lower section
Vertical
Vertical
8.51
234
30 -50-
Fig, 8.49).
FIGURE
g 50
-150
-150
S100
‘crustal
3
No
g
5:1
.
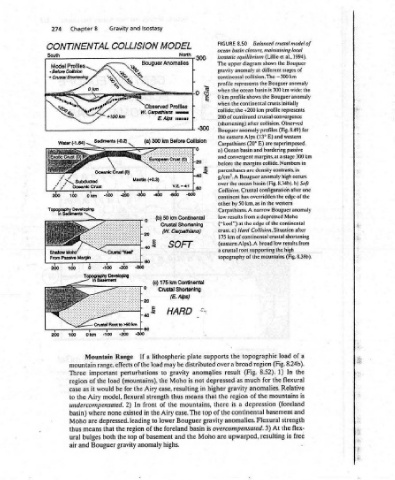
Zone Subduction conti- convergent Ata Margin) Continental (Convergent that similar to effect edge an is anomaly air free of the form main margin. the nental contributiorts main the words, other In 8.33). (Fig. margin continental passive a of seaward. compensated deepening water the to due effect
Balanced crustal model of closure, maintaining local 1994). al., (Lillie et Bouguer the shows different stages of 300 km The Bouguer anomaly wide: the is 300 km Bouguer anomaly crusts initially represents crusta) convergence after collision. Observed for anomaly profiles (Fig. 8.49) western E) and are superimposed. bordering passive margins, al a stage 300 km margins collide. Numbers in density
8.50 basin equilibrium upper diagram at anomaly continental collision. represents the basin ocean the profile shows the the continental collide; the +200 km profile 200 of cuntinued (13° the eastern Alps E) (20° and basin and convergent the are basin over the ocean has overridden 50 km, as Carpathians. A a from the edge at Hard km of continental crustal Alps). A root topography
FIGURE ocean isastatic The gravity profile when 0 km when (shortening) Bouguer Carpathians Ocean a) before parenthases g/cm*.A continent other by low results ("keel") crust.c) 175 (eastern crustal a a over result depressed-as the there of the are
_ supports anomalies higher that top gravity is Moho
399 ~300 20 a & 60 * distributed not in
r r E Before Collision oye = Pe [ 1;BOR Carpathians) plate is resulting means mountains, case. The Bouguer basin the
North
MODEL Bouguer Anomalies vena T *EOD! 50 km Continental Crustal Shortening (W. SOFT 175 km Continental Crustal Shortening (E. Alps) HARD lithospheric be may gravity Moho case, thus the lower foreland and highs.
lsostasy 300 km (a) * ‘ ake (b) 0 eA & ie (¢) 9 as ~& a load to the Airy strength of front the Airy in to the of of basement anomaly
and COLLISION ELC Slo T -300 If of the perturbations (mountains), the for flexural In 2) existed region top
Gravity Oceanic Crust (0) T T 200 300; : Crustal Root to >50 km T T -200 -100 Range range. effects load be model, none depressed. leading the that the both gravity
Chapter CONTINENTAL Profiles foes 100; Topography Developing T 100 mountain Three region as case the to basin) Moho thus ural and air
8 J 3 Water (-1.64) —_ Sediments (-0.2) 2m T Joken', Sr Darernen 60 T Okm Mountain important the of would it Airy undercompensated. where are means bulges Bouguer
274 South Model + Before Collision PL iv 4+ 200)» 200