
Page 289 - Whole Earth Geophysics An Introductory Textbook For Geologists And Geophysicists
P. 289
: ‘ 5000
271 KY Mountain Range the previous series of range. Bouguer lows the ocean;
Expressions \ _— Bouguer +2.67) T 4000 (180 km). Density contrasts (Ap in g/cm*) lithosphere relative to lower crust; critical boundaries lead to free areas under the curve sum to zero Moho, staying near zero over the mountain inverse relationship between range.
Gravity 8, ame Continental Margin Topography. = (Ap three the values occur where bathymetry is deep in ridge. and mountain
their the negative form of the beneath ridges The
and ate Se Mey SAmpeebrtnmen, a T 3000 lithosphere is thick rift, mid-ocean
Settings ae _ i Mid-Ocean Ridge =-1.64) 1 _ km deepest to upper crust: mantle the contributions from positive and the the crust rifts and mid-ocean
ne”
mae
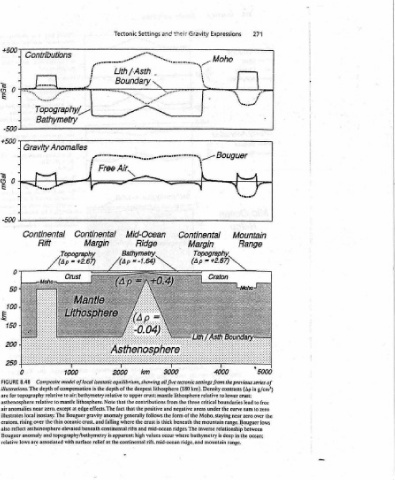
Tectonic ae Lith /Asth Boundary Hy, Hy Air. Bathymetry. (Ap T 2000 Composite model of local isostatic equilibrium, showing all five tectonic settings from that fact Bouguer gravity anomaly generally follows the falling where relief at the continental
pavwemewnme™ Free
” Continental Margin of compensation is the depth of the lithosphere. Note that edge effects. The topography/bathymetry is apparent: high
Se ee, Topography +2.67) = T 1000 at thin oceanic crust, and asthenosphere elevated beneath continental
Contributions i Topography/_- Bathymetry Gravity Anomalies ma Continental Rift (Ap for topography relative to air; bathymetry relative to mantle relative air anomalies near zero. except isostasy. The lows are associated with surface
+500 4 jebuw | 4 -500 +500 4 S -500 50 100 150 0 8.48 FIGURE illustrations. The depth are asthenosphere illustrates local cratons, rising over the also reflect Bouguer anomaly and relative
7
T
]
jepw
of free air 2km = km 48.35 thermally from its supporting crustal roots of tec- (or distrib- analyze, surface seis- surveys
General form and Bouguer gravity anomalies at a Parameters are: = 46.35 km deep) thickness of mantle part of 133.65 km. = (normal ins lithosphere): range the controlled, lithosphere/asthenosphere boundary equilibrates to a horizontal air and Bouguer anomalies the classic "Batman anomal. the major contributions are lithosphere forms general five the “background” interpreting contributions distribution
8.47 range. At the mountains: topography of height thickness of crust = (Moho lithosphere the h, = 33km = 147 km. mountain old topography and (Fig. 8.38). the shows of each the and major mass of would book); this on from
FIGURE mountain = h, = h, = h,, Outside continental =0 h,, im an In surface. Free thus reveal because the root cases, such relief. 8.48) (Fig. at anomalies, represents it modeling before the understanding problems analyze isostasy. local from understanding to useful situation ideal of cover inside based structure depths Moho
7 LS Stmemememene it” Alps).In the for topographic the model composite gravity Bouguer because important appreciate should By setting. then can one of deviation information An region. front (see intra-crustal and 4) 6.39); to
we"
lsostasy i. +2.67) ‘Se 2.18 lessen The and is one particular terms present a of topography 6.23
and oN = Craton Fig. that air free figure that a situation, in strength state thickness (Figs.
Gravity J 4 4 ; Nevada; excesses Model and The anomalies in isostatic Maps maps isostatic 1) of: sediment profiles
4
+300 0 -300 +200 30 ~300 Topography (Ap mass anomalies anomaly maps
8 8 g Sierra Composite settings. local lithospheric Anomaly and 3) reflection
Chapter the for represent contributions. tonic “regional”) gravity a for and Gravity ution together, geology; mic
Contributions ———~ weeem monn —— seers
270 Topography Moho LithyAsth Gravity Anomalies Free Alr Bouguer Mountain Range Gravity