
Page 101 - Fluid Power Engineering
P. 101
W i nd Measurement 79
FIGURE 6-3 Sonic anemometer to measure all three components of wind
velocity. (With permission of Campbell Scientific, CSAT3 3-D sonic
anemometer.)
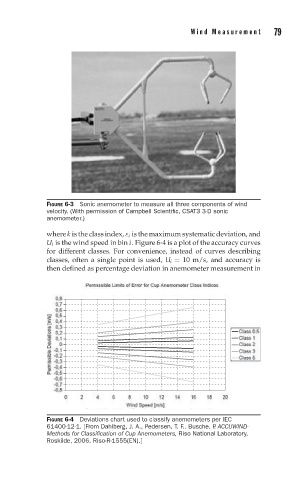
where k is the class index, ε i is the maximum systematic deviation, and
U i is the wind speed in bin i. Figure 6-4 is a plot of the accuracy curves
for different classes. For convenience, instead of curves describing
classes, often a single point is used, U i = 10 m/s, and accuracy is
then defined as percentage deviation in anemometer measurement in
FIGURE 6-4 Deviations chart used to classify anemometers per IEC
.
61400-12-1. [From Dahlberg, J. A., Pedersen, T. F., Busche, P ACCUWIND-
Methods for Classification of Cup Anemometers, Riso National Laboratory,
Roskilde, 2006. Riso-R-1555(EN).]