
Page 106 - Fluid Power Engineering
P. 106
84 Chapter Six
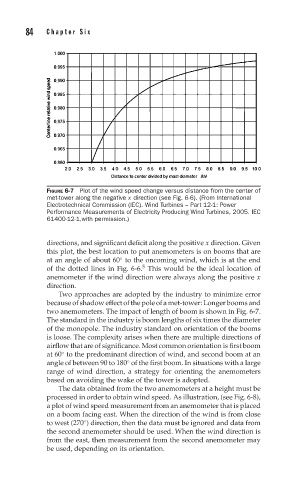
FIGURE 6-7 Plot of the wind speed change versus distance from the center of
met-tower along the negative x direction (see Fig. 6-6). (From International
Electrotechnical Commission (IEC). Wind Turbines – Part 12-1: Power
Performance Measurements of Electricity Producing Wind Turbines, 2005. IEC
61400-12-1,with permission.)
directions, and significant deficit along the positive x direction. Given
this plot, the best location to put anemometers is on booms that are
◦
at an angle of about 60 to the oncoming wind, which is at the end
5
of the dotted lines in Fig. 6-6. This would be the ideal location of
anemometer if the wind direction were always along the positive x
direction.
Two approaches are adopted by the industry to minimize error
because of shadow effect of the pole of a met-tower: Longer booms and
two anemometers. The impact of length of boom is shown in Fig. 6-7.
The standard in the industry is boom lengths of six times the diameter
of the monopole. The industry standard on orientation of the booms
is loose. The complexity arises when there are multiple directions of
airflow that are of significance. Most common orientation is first boom
at 60 to the predominant direction of wind, and second boom at an
◦
angle of between 90 to 180 of the first boom. In situations with a large
◦
range of wind direction, a strategy for orienting the anemometers
based on avoiding the wake of the tower is adopted.
The data obtained from the two anemometers at a height must be
processed in order to obtain wind speed. As illustration, (see Fig. 6-8),
a plot of wind speed measurement from an anemometer that is placed
on a boom facing east. When the direction of the wind is from close
to west (270 ) direction, then the data must be ignored and data from
◦
the second anemometer should be used. When the wind direction is
from the east, then measurement from the second anemometer may
be used, depending on its orientation.