
Page 107 - Fluid Power Engineering
P. 107
W i nd Measurement 85
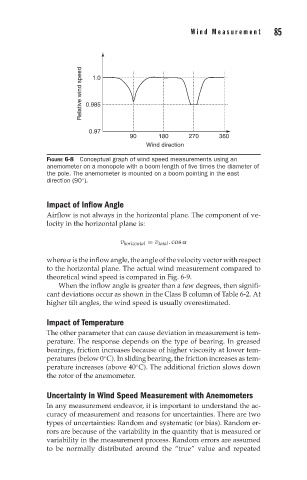
Relative wind speed 0.985
1.0
0.97
90 180 270 360
Wind direction
FIGURE 6-8 Conceptual graph of wind speed measurements using an
anemometer on a monopole with a boom length of five times the diameter of
the pole. The anemometer is mounted on a boom pointing in the east
◦
direction (90 ).
Impact of Inflow Angle
Airflow is not always in the horizontal plane. The component of ve-
locity in the horizontal plane is:
v horizontal = v total . cos α
whereα istheinflowangle,theangleofthevelocityvectorwithrespect
to the horizontal plane. The actual wind measurement compared to
theoretical wind speed is compared in Fig. 6-9.
When the inflow angle is greater than a few degrees, then signifi-
cant deviations occur as shown in the Class B column of Table 6-2. At
higher tilt angles, the wind speed is usually overestimated.
Impact of Temperature
The other parameter that can cause deviation in measurement is tem-
perature. The response depends on the type of bearing. In greased
bearings, friction increases because of higher viscosity at lower tem-
peratures (below 0 C). In sliding bearing, the friction increases as tem-
◦
◦
perature increases (above 40 C). The additional friction slows down
the rotor of the anemometer.
Uncertainty in Wind Speed Measurement with Anemometers
In any measurement endeavor, it is important to understand the ac-
curacy of measurement and reasons for uncertainties. There are two
types of uncertainties: Random and systematic (or bias). Random er-
rors are because of the variability in the quantity that is measured or
variability in the measurement process. Random errors are assumed
to be normally distributed around the “true” value and repeated