
Page 112 - Fluid Power Engineering
P. 112
90 Chapter Six
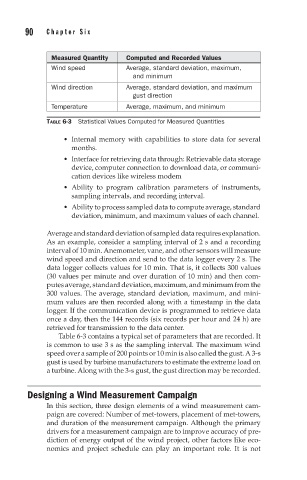
Measured Quantity Computed and Recorded Values
Wind speed Average, standard deviation, maximum,
and minimum
Wind direction Average, standard deviation, and maximum
gust direction
Temperature Average, maximum, and minimum
TABLE 6-3 Statistical Values Computed for Measured Quantities
Internal memory with capabilities to store data for several
months.
Interface for retrieving data through: Retrievable data storage
device, computer connection to download data, or communi-
cation devices like wireless modem
Ability to program calibration parameters of instruments,
sampling intervals, and recording interval.
Ability to process sampled data to compute average, standard
deviation, minimum, and maximum values of each channel.
Averageandstandarddeviationofsampleddatarequiresexplanation.
As an example, consider a sampling interval of 2 s and a recording
interval of 10 min. Anemometer, vane, and other sensors will measure
wind speed and direction and send to the data logger every 2 s. The
data logger collects values for 10 min. That is, it collects 300 values
(30 values per minute and over duration of 10 min) and then com-
putes average, standard deviation, maximum, and minimum from the
300 values. The average, standard deviation, maximum, and mini-
mum values are then recorded along with a timestamp in the data
logger. If the communication device is programmed to retrieve data
once a day, then the 144 records (six records per hour and 24 h) are
retrieved for transmission to the data center.
Table 6-3 contains a typical set of parameters that are recorded. It
is common to use 3 s as the sampling interval. The maximum wind
speed over a sample of 200 points or 10 min is also called the gust. A 3-s
gust is used by turbine manufacturers to estimate the extreme load on
a turbine. Along with the 3-s gust, the gust direction may be recorded.
Designing a Wind Measurement Campaign
In this section, three design elements of a wind measurement cam-
paign are covered: Number of met-towers, placement of met-towers,
and duration of the measurement campaign. Although the primary
drivers for a measurement campaign are to improve accuracy of pre-
diction of energy output of the wind project, other factors like eco-
nomics and project schedule can play an important role. It is not