
Page 116 - Fluid Power Engineering
P. 116
94 Chapter Six
Frequency (%)
0-5 m/s
N 5-10 m/s
12.5 NNE 10-15 m/s
NNW
10 15-20 m/s
7.5 20-40 m/s
ENE
WNW
5
2.5
W E
10
WSW ESE
SSW S SSE
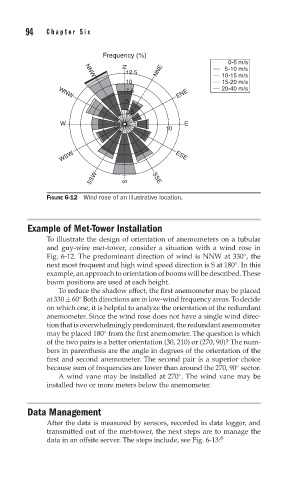
FIGURE 6-12 Wind rose of an illustrative location.
Example of Met-Tower Installation
To illustrate the design of orientation of anemometers on a tubular
and guy-wire met-tower, consider a situation with a wind rose in
Fig. 6-12. The predominant direction of wind is NNW at 330 , the
◦
next most frequent and high wind speed direction is S at 180 . In this
◦
example, an approach to orientation of booms will be described. These
boom positions are used at each height.
To reduce the shadow effect, the first anemometer may be placed
at 330 ± 60 Both directions are in low-wind frequency areas. To decide
◦
on which one, it is helpful to analyze the orientation of the redundant
anemometer. Since the wind rose does not have a single wind direc-
tion that is overwhelmingly predominant, the redundant anemometer
may be placed 180 from the first anemometer. The question is which
◦
of the two pairs is a better orientation (30, 210) or (270, 90)? The num-
bers in parenthesis are the angle in degrees of the orientation of the
first and second anemometer. The second pair is a superior choice
◦
because sum of frequencies are lower than around the 270, 90 sector.
A wind vane may be installed at 270 . The wind vane may be
◦
installed two or more meters below the anemometer.
Data Management
After the data is measured by sensors, recorded in data logger, and
transmitted out of the met-tower, the next steps are to manage the
data in an offsite server. The steps include, see Fig. 6-13: 8