
Page 119 - Fluid Power Engineering
P. 119
W i nd Measurement 97
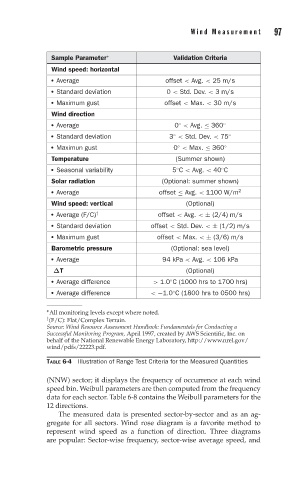
Sample Parameter ∗ Validation Criteria
Wind speed: horizontal
Average offset < Avg. < 25 m/s
Standard deviation 0 < Std. Dev. < 3 m/s
Maximum gust offset < Max. < 30 m/s
Wind direction
Average 0 < Avg. ≤ 360
◦ ◦
Standard deviation 3 < Std. Dev. < 75
◦ ◦
Maximun gust 0 < Max. ≤ 360
◦ ◦
Temperature (Summer shown)
Seasonal variability 5 C < Avg. < 40 C
◦ ◦
Solar radiation (Optional: summer shown)
Average offset ≤ Avg. < 1100 W/m
2
Wind speed: vertical (Optional)
Average (F/C) offset < Avg. < ± (2/4) m/s
†
Standard deviation offset < Std. Dev. < ± (1/2) m/s
Maximum gust offset < Max. < ± (3/6) m/s
Barometric pressure (Optional: sea level)
Average 94 kPa < Avg. < 106 kPa
ΔT (Optional)
Average difference > 1.0 C (1000 hrs to 1700 hrs)
◦
Average difference < −1.0 C (1800 hrs to 0500 hrs)
◦
∗ All monitoring levels except where noted.
† (F/C): Flat/Complex Terrain.
Source: Wind Resource Assessment Handbook: Fundamentals for Conducting a
Successful Monitoring Program, April 1997, created by AWS Scientific, Inc. on
behalf of the National Renewable Energy Laboratory, http://www.nrel.gov/
wind/pdfs/22223.pdf.
TABLE 6-4 Illustration of Range Test Criteria for the Measured Quantities
(NNW) sector; it displays the frequency of occurrence at each wind
speed bin. Weibull parameters are then computed from the frequency
data for each sector. Table 6-8 contains the Weibull parameters for the
12 directions.
The measured data is presented sector-by-sector and as an ag-
gregate for all sectors. Wind rose diagram is a favorite method to
represent wind speed as a function of direction. Three diagrams
are popular: Sector-wise frequency, sector-wise average speed, and