
Page 120 - Fluid Power Engineering
P. 120
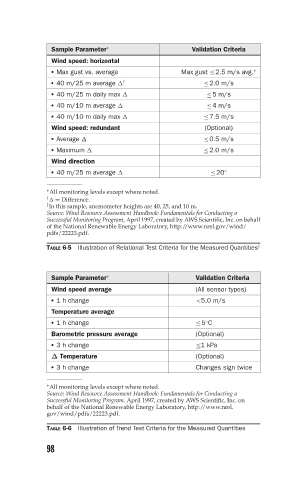
Sample Parameter ∗                   Validation Criteria
               Wind speed: horizontal
                Max gust vs. average             Max gust ≤2.5 m/s avg.
                                                                     ∗
                40 m/25 m average                       ≤2.0 m/s
                                  †
                40 m/25 m daily max                     ≤5 m/s

                40 m/10 m average                       ≤4 m/s

                40 m/10 m daily max                     ≤7.5 m/s

               Wind speed: redundant                    (Optional)
                Average                                 ≤0.5 m/s

                Maximum                                 ≤2.0 m/s

               Wind direction
                  40 m/25 m average                      ≤20 ◦
              All monitoring levels except where noted.
              ∗
              †   = Difference.
              ‡
              In this sample, anemometer heights are 40, 25, and 10 m.
              Source: Wind Resource Assessment Handbook: Fundamentals for Conducting a
              Successful Monitoring Program, April 1997, created by AWS Scientific, Inc. on behalf
              of the National Renewable Energy Laboratory, http://www.nrel.gov/wind/
              pdfs/22223.pdf.
              TABLE 6-5  Illustration of Relational Test Criteria for the Measured Quantities ‡


               Sample Parameter ∗                    Validation Criteria
               Wind speed average                    (All sensor types)
                1 h change                           <5.0 m/s

               Temperature average
                1 h change                           ≤5 C
                                                        ◦
               Barometric pressure average           (Optional)
                3 h change                           ≤1kPa

               Δ Temperature                         (Optional)
                3 h change                           Changes sign twice

              ∗ All monitoring levels except where noted.
              Source: Wind Resource Assessment Handbook: Fundamentals for Conducting a
              Successful Monitoring Program, April 1997, created by AWS Scientific, Inc. on
              behalf of the National Renewable Energy Laboratory, http://www.nrel.
              gov/wind/pdfs/22223.pdf.
              TABLE 6-6 Illustration of Trend Test Criteria for the Measured Quantities

              98