Page 123 - Fluid Power Engineering
P. 123

100   Chapter Six


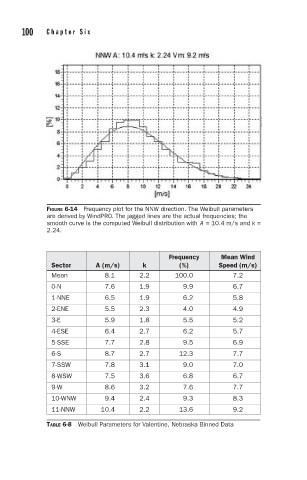
              FIGURE 6-14 Frequency plot for the NNW direction. The Weibull parameters
              are derived by WindPRO. The jagged lines are the actual frequencies; the
              smooth curve is the computed Weibull distribution with A = 10.4 m/s and k =
              2.24.


                                              Frequency     Mean Wind
               Sector      A (m/s)     k         (%)        Speed (m/s)
               Mean          8.1      2.2       100.0          7.2
               0-N           7.6      1.9         9.9          6.7
               1-NNE         6.5      1.9         6.2          5.8
               2-ENE         5.5      2.3         4.0          4.9
               3-E           5.9      1.8         5.5          5.2
               4-ESE         6.4      2.7         6.2          5.7
               5-SSE         7.7      2.8         9.5          6.9
               6-S           8.7      2.7        12.3          7.7
               7-SSW         7.8      3.1         9.0          7.0
               8-WSW         7.5      3.6         6.8          6.7
               9-W           8.6      3.2         7.6          7.7
               10-WNW        9.4      2.4         9.3          8.3
               11-NNW       10.4      2.2        13.6          9.2
              TABLE 6-8 Weibull Parameters for Valentine, Nebraska Binned Data
   118   119   120   121   122   123   124   125   126   127   128