
Page 128 - Fluid Power Engineering
P. 128
W i nd Measurement 105
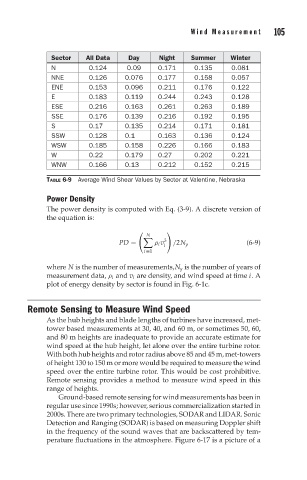
Sector All Data Day Night Summer Winter
N 0.124 0.09 0.171 0.135 0.081
NNE 0.126 0.076 0.177 0.158 0.057
ENE 0.153 0.096 0.211 0.176 0.122
E 0.183 0.119 0.244 0.243 0.128
ESE 0.216 0.163 0.261 0.263 0.189
SSE 0.176 0.139 0.216 0.192 0.195
S 0.17 0.135 0.214 0.171 0.181
SSW 0.128 0.1 0.163 0.136 0.124
WSW 0.185 0.158 0.226 0.166 0.183
W 0.22 0.179 0.27 0.202 0.221
WNW 0.166 0.13 0.212 0.152 0.215
TABLE 6-9 Average Wind Shear Values by Sector at Valentine, Nebraska
Power Density
The power density is computed with Eq. (3-9). A discrete version of
the equation is:
N
3
PD = ρ i v i /2N y (6-9)
i=1
where N is the number of measurements,N y is the number of years of
measurement data, ρ i and v i are density, and wind speed at time i.A
plot of energy density by sector is found in Fig. 6-1c.
Remote Sensing to Measure Wind Speed
As the hub heights and blade lengths of turbines have increased, met-
tower based measurements at 30, 40, and 60 m, or sometimes 50, 60,
and 80 m heights are inadequate to provide an accurate estimate for
wind speed at the hub height, let alone over the entire turbine rotor.
With both hub heights and rotor radius above 85 and 45 m, met-towers
of height 130 to 150 m or more would be required to measure the wind
speed over the entire turbine rotor. This would be cost prohibitive.
Remote sensing provides a method to measure wind speed in this
range of heights.
Ground-based remote sensing for wind measurements has been in
regular use since 1990s; however, serious commercialization started in
2000s. There are two primary technologies, SODAR and LIDAR. Sonic
Detection and Ranging (SODAR) is based on measuring Doppler shift
in the frequency of the sound waves that are backscattered by tem-
perature fluctuations in the atmosphere. Figure 6-17 is a picture of a