
Page 126 - Fluid Power Engineering
P. 126
W i nd Measurement 103
2
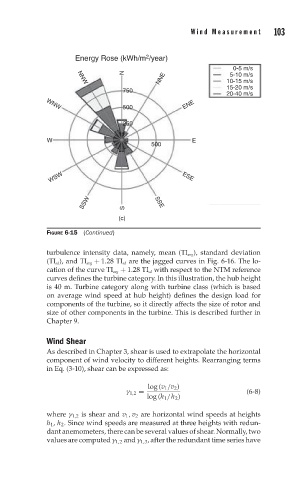
Energy Rose (kWh/m /year)
0-5 m/s
N 5-10 m/s
NNE 10-15 m/s
NNW
15-20 m/s
750
20-40 m/s
ENE
500
WNW
250
W E
500
WSW ESE
SSW S SSE
(c)
FIGURE 6-15 (Continued)
turbulence intensity data, namely, mean (TI avg ), standard deviation
(TI sd ), and TI avg + 1.28 TI sd are the jagged curves in Fig. 6-16. The lo-
cation of the curve TI avg + 1.28 TI sd with respect to the NTM reference
curves defines the turbine category. In this illustration, the hub height
is 40 m. Turbine category along with turbine class (which is based
on average wind speed at hub height) defines the design load for
components of the turbine, so it directly affects the size of rotor and
size of other components in the turbine. This is described further in
Chapter 9.
Wind Shear
As described in Chapter 3, shear is used to extrapolate the horizontal
component of wind velocity to different heights. Rearranging terms
in Eq. (3-10), shear can be expressed as:
log (v 1 /v 2 )
γ 1,2 = (6-8)
log (h 1 /h 2 )
where γ 1,2 is shear and v 1 , v 2 are horizontal wind speeds at heights
h 1 , h 2 . Since wind speeds are measured at three heights with redun-
dant anemometers, there can be several values of shear. Normally, two
values are computed γ 1,2 and γ 1,3 , after the redundant time series have