
Page 127 - Fluid Power Engineering
P. 127
104 Chapter Six
40.0m - 4
0.56
0.54
0.52
0.5
0.48
0.46
0.44
0.42
0.4
0.38
0.36
0.34
0.32
0.3
0.28
0.26
0.24
0.22
0.2
0.18
0.16
0.14
0.12
0.1
0.08
0.06
0.04
0.02
0
0 2 4 6 8 10 12 14 16 18 20 22 24 26 28 30 32 34 36 38 40
m/s
Mean value
Standard deviation
Mean+1.28*Sd (IEC 3)
IEC 61400-1 (ed 3) - Category A higher turbulence characteristics
IEC 61400-1 (ed 3) - Category B medium turbulence characteristics
IEC 61400-1 (ed 3) - Category C lower turbulence characteristics
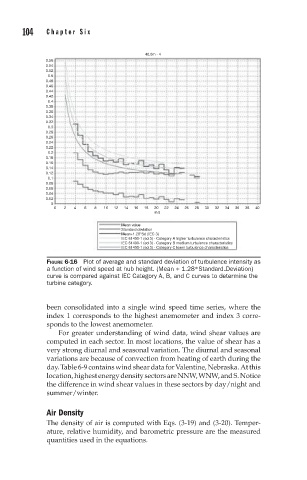
FIGURE 6-16 Plot of average and standard deviation of turbulence intensity as
a function of wind speed at hub height. (Mean + 1.28*Standard Deviation)
curve is compared against IEC Category A, B, and C curves to determine the
turbine category.
been consolidated into a single wind speed time series, where the
index 1 corresponds to the highest anemometer and index 3 corre-
sponds to the lowest anemometer.
For greater understanding of wind data, wind shear values are
computed in each sector. In most locations, the value of shear has a
very strong diurnal and seasonal variation. The diurnal and seasonal
variations are because of convection from heating of earth during the
day.Table6-9containswindsheardataforValentine,Nebraska.Atthis
location,highestenergydensitysectorsareNNW,WNW,andS.Notice
the difference in wind shear values in these sectors by day/night and
summer/winter.
Air Density
The density of air is computed with Eqs. (3-19) and (3-20). Temper-
ature, relative humidity, and barometric pressure are the measured
quantities used in the equations.