
Page 145 - Fluid Power Engineering
P. 145
W ind Resource Assessment 121
Roughness Length (m)
Height, m 0 0.03 0.1 0.4
10 9.6 6.6 5.7 4.5
25 10.5 7.9 7 5.8
50 11.2 9 8.2 7
100 12.1 10.4 9.6 8.3
200 13.1 12.6 11.5 10
∗ The four columns are for roughness classes 0, 1, 2, 4. The roughness lengths
are in the title row. All the data in the table is mean wind speed in meters per
second.
TABLE 7-2 Output of Wind Statistics Module of WAsP*
Table 7-2 shows the RWC, an output of the WAsP model for a
single direction sector. The table was created in WindPRO. If the RWC
is translated to site B with roughness length 0.03 (roughness class =
1) and the desired hub height is 100 m above the ground level, then
the estimated average annual wind speed is 10.4 m/s.
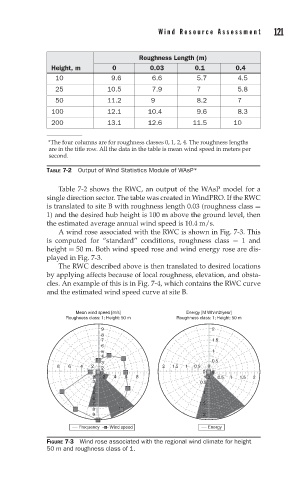
A wind rose associated with the RWC is shown in Fig. 7-3. This
is computed for “standard” conditions, roughness class = 1 and
height = 50 m. Both wind speed rose and wind energy rose are dis-
played in Fig. 7-3.
The RWC described above is then translated to desired locations
by applying affects because of local roughness, elevation, and obsta-
cles. An example of this is in Fig. 7-4, which contains the RWC curve
and the estimated wind speed curve at site B.
Mean wind speed [m/s] Energy [M Wh/m2/year]
Roughness class: 1; Height: 50 m Roughness class: 1; Height: 50 m
9 2
8
7 1.5
6
5 1
4
0.5
3
8 6 4 2 2 2 1.5 1 0.5 0
0 0
2 2 4 6 8 0 0.5 1 1.5 2
3 0.5
4
5 1
6
7 1.5
8
9 2
Frequency Wind speed Energy
FIGURE 7-3 Wind rose associated with the regional wind climate for height
50 m and roughness class of 1.