Page 146 - Fluid Power Engineering
P. 146

122   Chapter Seven


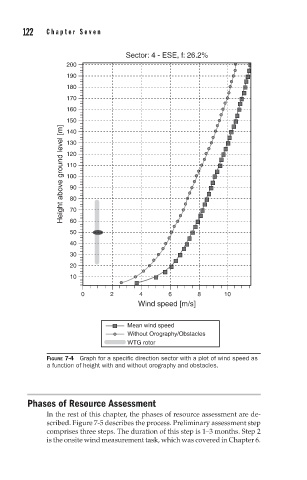
                                   Sector: 4 - ESE, f: 26.2%
                   200
                   190
                   180
                   170
                   160
                   150
                  Height above ground level [m]  120
                   140
                   130

                   110
                   100
                    90
                    80
                    70
                    60
                    50
                    40
                    30
                    20
                    10

                       0       2      4       6       8      10
                                      Wind speed [m/s]


                                   Mean wind speed
                                   Without Orography/Obstacles
                                   WTG rotor

              FIGURE 7-4 Graph for a specific direction sector with a plot of wind speed as
              a function of height with and without orography and obstacles.


        Phases of Resource Assessment
              In the rest of this chapter, the phases of resource assessment are de-
              scribed. Figure 7-5 describes the process. Preliminary assessment step
              comprises three steps. The duration of this step is 1–3 months. Step 2
              is the onsite wind measurement task, which was covered in Chapter 6.
   141   142   143   144   145   146   147   148   149   150   151