
Page 153 - Fluid Power Engineering
P. 153
128 Chapter Seven
Time
Heights, Resolu-
Location Coordinates m tion, h Duration Type
Valentine, 42.954N, 10, 25, 1 3/21/1995 Onsite
NE 100.504W 40 to 4/1/1999 met-tower
NCAR 42.500N, 10, 42 6 4/1975 to Long-term
100.00W 4/1999 reference
TABLE 7-3 Characteristics of Measured Data and Long-Term Reference Data
for the MCP Example
in this paper, the authors show a significant reduction in uncertainty
when 14 years of reference data is used versus 44 years of reference
data. This is counterintuitive. However, the authors illustrate that
there was a change in reference data about 14 years ago, probably
because of change in instruments. This underscores the need for not
only picking the right long-term reference data but also picking a time
period that has consistent data.
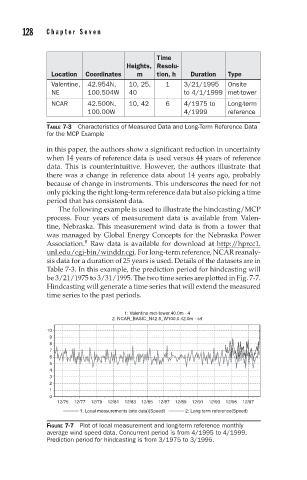
The following example is used to illustrate the hindcasting/MCP
process. Four years of measurement data is available from Valen-
tine, Nebraska. This measurement wind data is from a tower that
was managed by Global Energy Concepts for the Nebraska Power
8
Association. Raw data is available for download at http://hprcc1.
unl.edu/cgi-bin/winddr.cgi. For long-term reference, NCAR reanaly-
sis data for a duration of 25 years is used. Details of the datasets are in
Table 7-3. In this example, the prediction period for hindcasting will
be 3/21/1975 to 3/31/1995. The two time series are plotted in Fig. 7-7.
Hindcasting will generate a time series that will extend the measured
time series to the past periods.
1: Valentine met-tower.40.0m - 4
2: NCAR_BASIC_N42.5_W100.0.42.0m - srf
10
9
8
7
6
5
4
3
2
1
0
12/75 12/77 12/79 12/81 12/83 12/85 12/87 12/89 12/91 12/93 12/95 12/97
1: Local measurements (site data)(Speed) 2: Long term reference(Speed)
FIGURE 7-7 Plot of local measurement and long-term reference monthly
average wind speed data. Concurrent period is from 4/1995 to 4/1999.
Prediction period for hindcasting is from 3/1975 to 3/1995.