
Page 155 - Fluid Power Engineering
P. 155
130 Chapter Seven
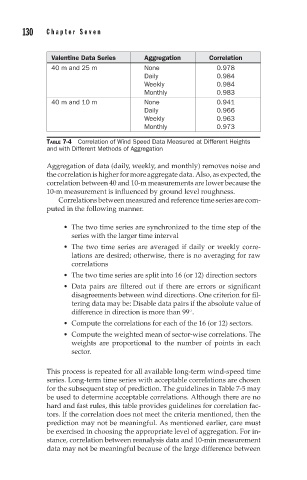
Valentine Data Series Aggregation Correlation
40 m and 25 m None 0.978
Daily 0.984
Weekly 0.984
Monthly 0.983
40 m and 10 m None 0.941
Daily 0.966
Weekly 0.963
Monthly 0.973
TABLE 7-4 Correlation of Wind Speed Data Measured at Different Heights
and with Different Methods of Aggregation
Aggregation of data (daily, weekly, and monthly) removes noise and
the correlation is higher for more aggregate data. Also, as expected, the
correlation between 40 and 10-m measurements are lower because the
10-m measurement is influenced by ground level roughness.
Correlations between measured and reference time series are com-
puted in the following manner.
The two time series are synchronized to the time step of the
series with the larger time interval
The two time series are averaged if daily or weekly corre-
lations are desired; otherwise, there is no averaging for raw
correlations
The two time series are split into 16 (or 12) direction sectors
Data pairs are filtered out if there are errors or significant
disagreements between wind directions. One criterion for fil-
tering data may be: Disable data pairs if the absolute value of
difference in direction is more than 99 .
◦
Compute the correlations for each of the 16 (or 12) sectors.
Compute the weighted mean of sector-wise correlations. The
weights are proportional to the number of points in each
sector.
This process is repeated for all available long-term wind-speed time
series. Long-term time series with acceptable correlations are chosen
for the subsequent step of prediction. The guidelines in Table 7-5 may
be used to determine acceptable correlations. Although there are no
hard and fast rules, this table provides guidelines for correlation fac-
tors. If the correlation does not meet the criteria mentioned, then the
prediction may not be meaningful. As mentioned earlier, care must
be exercised in choosing the appropriate level of aggregation. For in-
stance, correlation between reanalysis data and 10-min measurement
data may not be meaningful because of the large difference between