
Page 159 - Fluid Power Engineering
P. 159
W ind Resource Assessment 133
Wind Speed Aggregate Correlation
Daily average 0.782
Weekly average 0.795
Monthly average 0.884
TABLE 7-7 Correlation between Valentine and NCAR Wind Speed Data for
Average Over Different Time Periods
Thus far, only two long-term reference data sources have been con-
sidered: Airport and reanalysis. For analysis of large wind farm in
complex terrain, virtual mast data may be used as long-term refer-
ence data. Virtual mast data is generated from mesoscale models, CFD
simulation, or other similar models.
Predict
The objective of this step is to use the short-term onsite wind measure-
ment data to predict long-term wind data at proposed WTG sites. As
mentioned before, predict here means estimating the past. This predic-
tion is important to obtain a lower uncertainty estimate for the average
annual energy production over the 20-plus year life of a wind turbine.
Three most commonly used methods for prediction will be described:
Regression, Weibull Parameter Scaling, and Matrix Method. In addi-
tion to the prediction methods, a statistical method is used to create
the long-term time series.
11
10.5
10
9.5
9
8.5
8
7.5
7
6.5
6
5.5
5
4.5
4
3.5
3
2.5
2
1.5
1
0.5
0
04/95 07/95 10/95 01/96 04/96 07/96 10/96 01/97 04/97 07/97 10/97 01/98 04/98 07/98 10/98 01/99 04/99
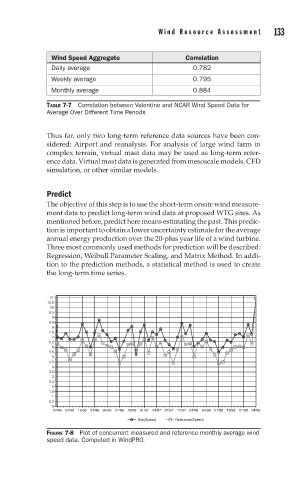
Site(Speed) Reference(Speed)
FIGURE 7-8 Plot of concurrent measured and reference monthly average wind
speed data. Computed in WindPRO.