
Page 156 - Fluid Power Engineering
P. 156
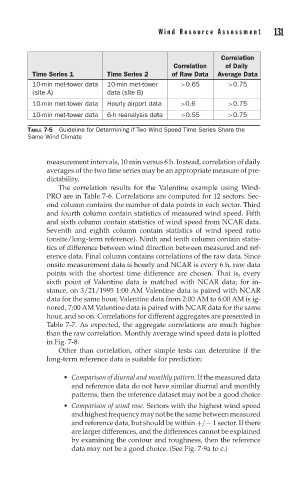
W ind Resource Assessment      131


                                                            Correlation
                                               Correlation   of Daily
          Time Series 1       Time Series 2    of Raw Data  Average Data
          10-min met-tower data  10-min met-tower  >0.65      >0.75
          (site A)            data (site B)
          10-min met-tower data  Hourly airport data  >0.6    >0.75
          10-min met-tower data  6-h reanalysis data  >0.55   >0.75
        TABLE 7-5  Guideline for Determining if Two Wind Speed Time Series Share the
        Same Wind Climate


              measurement intervals, 10 min versus 6 h. Instead, correlation of daily
              averages of the two time series may be an appropriate measure of pre-
              dictability.
                 The correlation results for the Valentine example using Wind-
              PRO are in Table 7-6. Correlations are computed for 12 sectors. Sec-
              ond column contains the number of data points in each sector. Third
              and fourth column contain statistics of measured wind speed. Fifth
              and sixth column contain statistics of wind speed from NCAR data.
              Seventh and eighth column contain statistics of wind speed ratio
              (onsite/long-term reference). Ninth and tenth column contain statis-
              tics of difference between wind direction between measured and ref-
              erence data. Final column contains correlations of the raw data. Since
              onsite measurement data is hourly and NCAR is every 6 h, raw data
              points with the shortest time difference are chosen. That is, every
              sixth point of Valentine data is matched with NCAR data; for in-
              stance, on 3/21/1995 1:00 AM Valentine data is paired with NCAR
              data for the same hour, Valentine data from 2:00 AM to 6:00 AM is ig-
              nored, 7:00 AM Valentine data is paired with NCAR data for the same
              hour, and so on. Correlations for different aggregates are presented in
              Table 7-7. As expected, the aggregate correlations are much higher
              than the raw correlation. Monthly average wind speed data is plotted
              in Fig. 7-8.
                 Other than correlation, other simple tests can determine if the
              long-term reference data is suitable for prediction:
                    Comparison of diurnal and monthly pattern. If the measured data

                    and reference data do not have similar diurnal and monthly
                    patterns, then the reference dataset may not be a good choice
                    Comparison of wind rose. Sectors with the highest wind speed

                    andhighestfrequencymaynotbethesamebetweenmeasured
                    and reference data, but should be within +/− 1 sector. If there
                    are larger differences, and the differences cannot be explained
                    by examining the contour and roughness, then the reference
                    data may not be a good choice. (See Fig. 7-9a to c.)